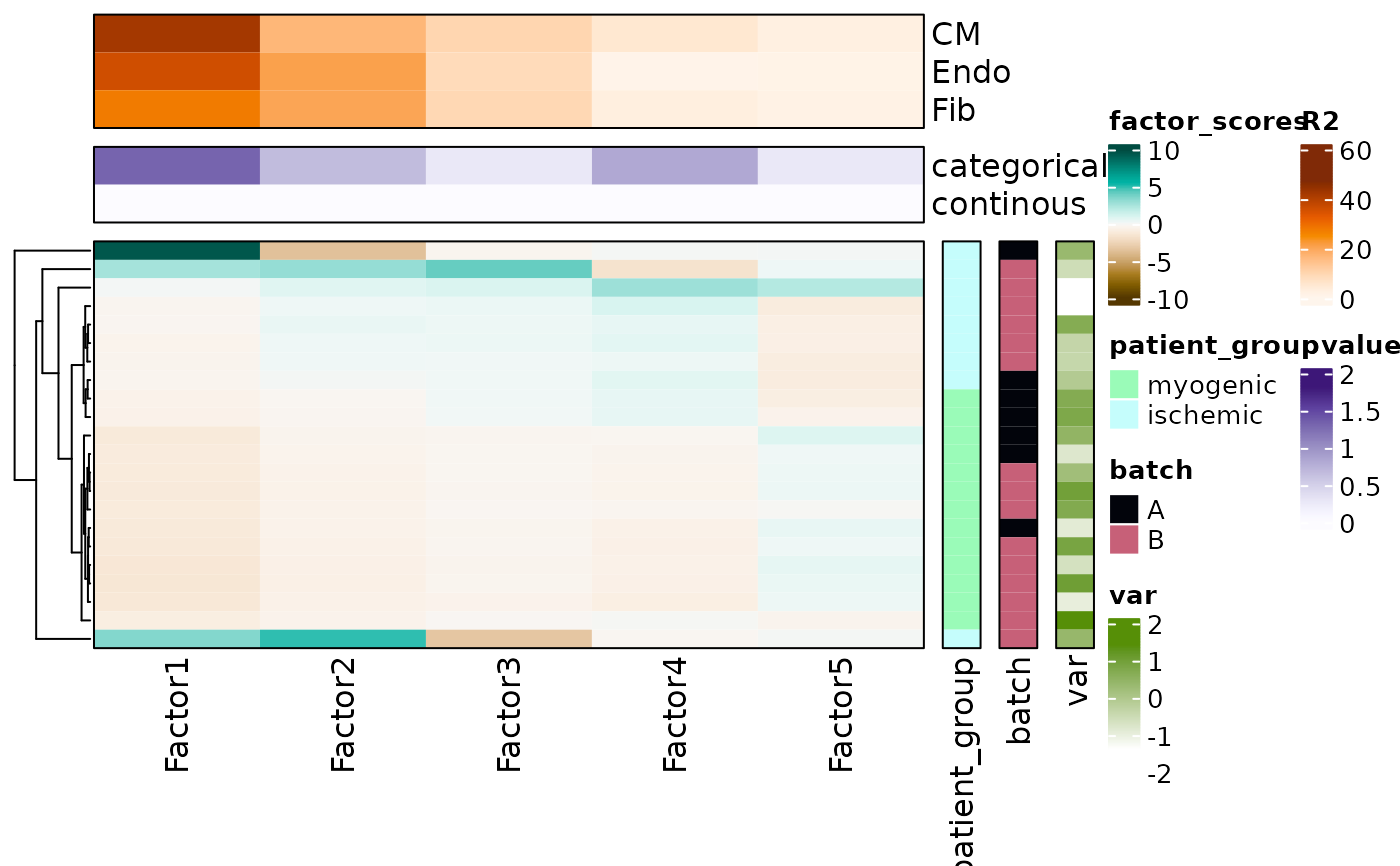
Visualize MOFA multicellular model
plot_MOFA_hmap.RdPlots a heatmap with factor scores annotated by sample's information and factor's statistics
Usage
plot_MOFA_hmap(
  model,
  group = FALSE,
  metadata,
  sample_id_column = "sample",
  sample_anns,
  assoc_list = NULL,
  col_rows = NULL
)
Arguments
- model
A MOFA2 model.
- group
Boolean flag TRUE/FALSE, to specify if a grouped MOFA model is provided.
- metadata
A data frame containing the annotations of the samples included in the MOFA model.
- sample_id_column
A string character that refers to the column in
metadatawhere the sample identifier is located.- sample_anns
A vector containing strings that refer to the columns in
metadatato be used to annotate samples- assoc_list
A named list collecting results of
MOFAcellulaR::get_associations()- col_rows
A named list of lists containing at the first index, all sample_anns used, and at the second index, all levels of an annotation within the first index. As required by
ComplexHeatmap::rowAnnotationcol parameter.
Details
This function summarizes a MOFA2 model by plotting and clustering the factor scores across samples.
Additionally, it allows you to annotate each sample with categorical or continous variables. Finally,
for each factor, the amount of explained variance captured for each cell type is shown. If provided,
summary of the association statistics and sample variables can be provided
Examples
inputs_dir <- base::system.file("extdata", package = "MOFAcellulaR")
model <- MOFA2::load_model(file.path(inputs_dir, "testmodel.hdf5"))
#> Warning: Factor(s) 1 are strongly correlated with the total number of expressed features for at least one of your omics. Such factors appear when there are differences in the total 'levels' between your samples, *sometimes* because of poor normalisation in the preprocessing steps.
metadata <- readRDS(file.path(inputs_dir, "testmetadata.rds"))
metadata$var <- stats::rnorm(nrow(metadata))

categorical_assoc <- get_associations(model = model,
                                      metadata = metadata,
                                      sample_id_column = "sample",
                                      test_variable = "patient_group",
                                      test_type = "categorical",
                                      group = FALSE)

continuous_assoc <- get_associations(model = model,
                                     metadata = metadata,
                                     sample_id_column = "sample",
                                     test_variable = "var",
                                     test_type = "continous",
                                     group = FALSE)


assoc_list = list("categorical" = categorical_assoc, "continous" = continuous_assoc)

plot_MOFA_hmap(model = model,
               group = FALSE,
               metadata = metadata,
               sample_id_column = "sample",
               sample_anns = c("patient_group", "batch", "var"),
               assoc_list = assoc_list)
