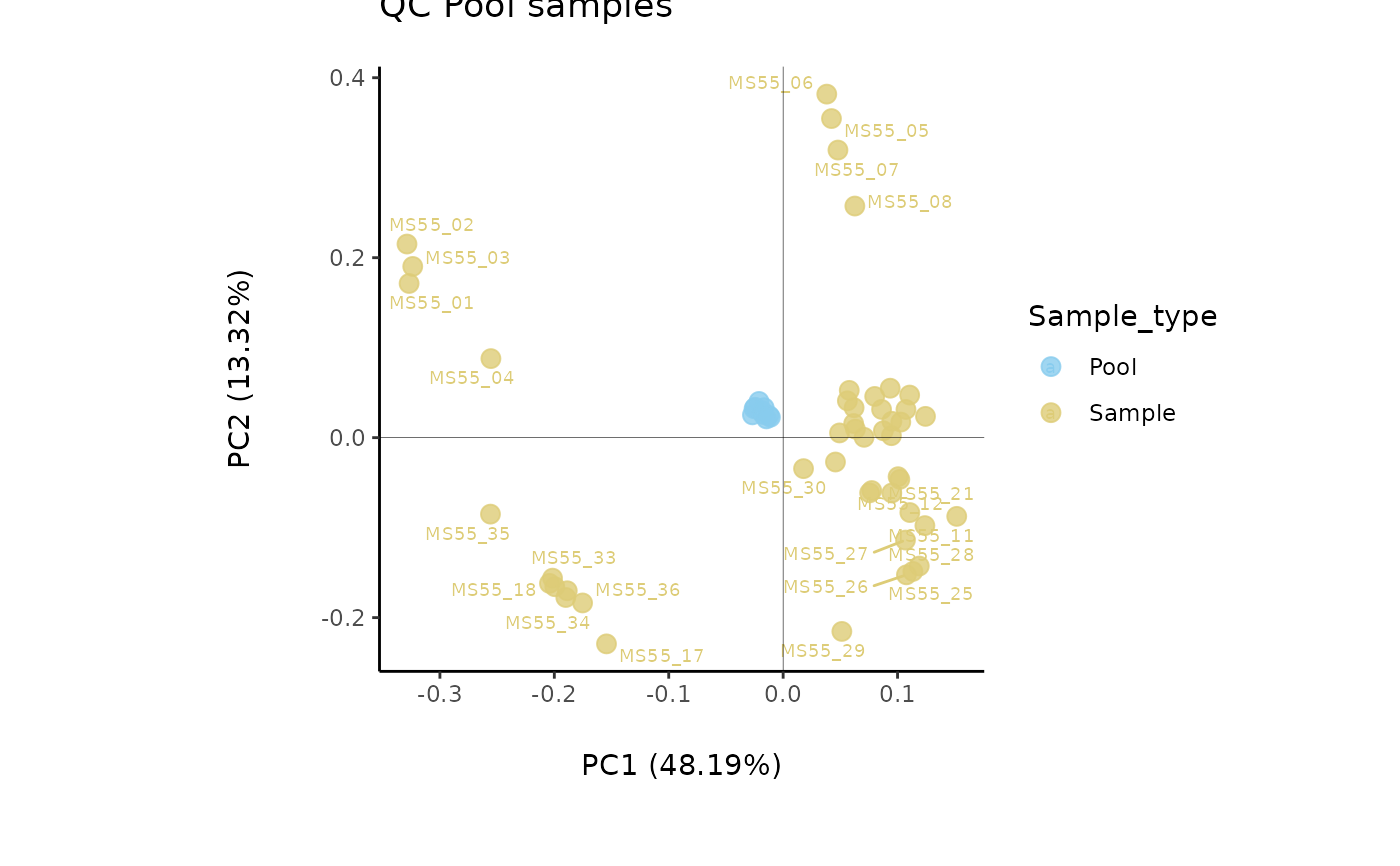
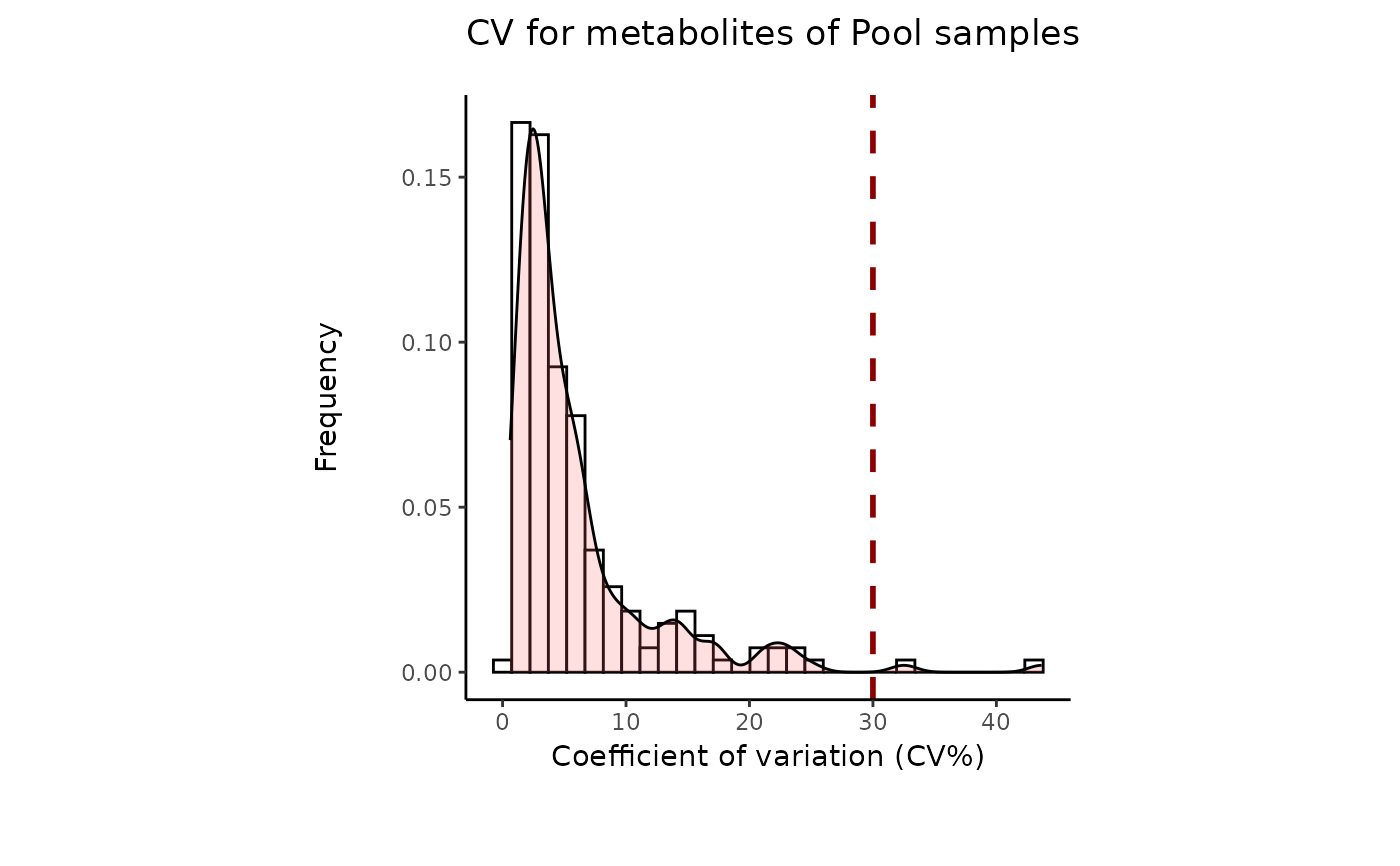
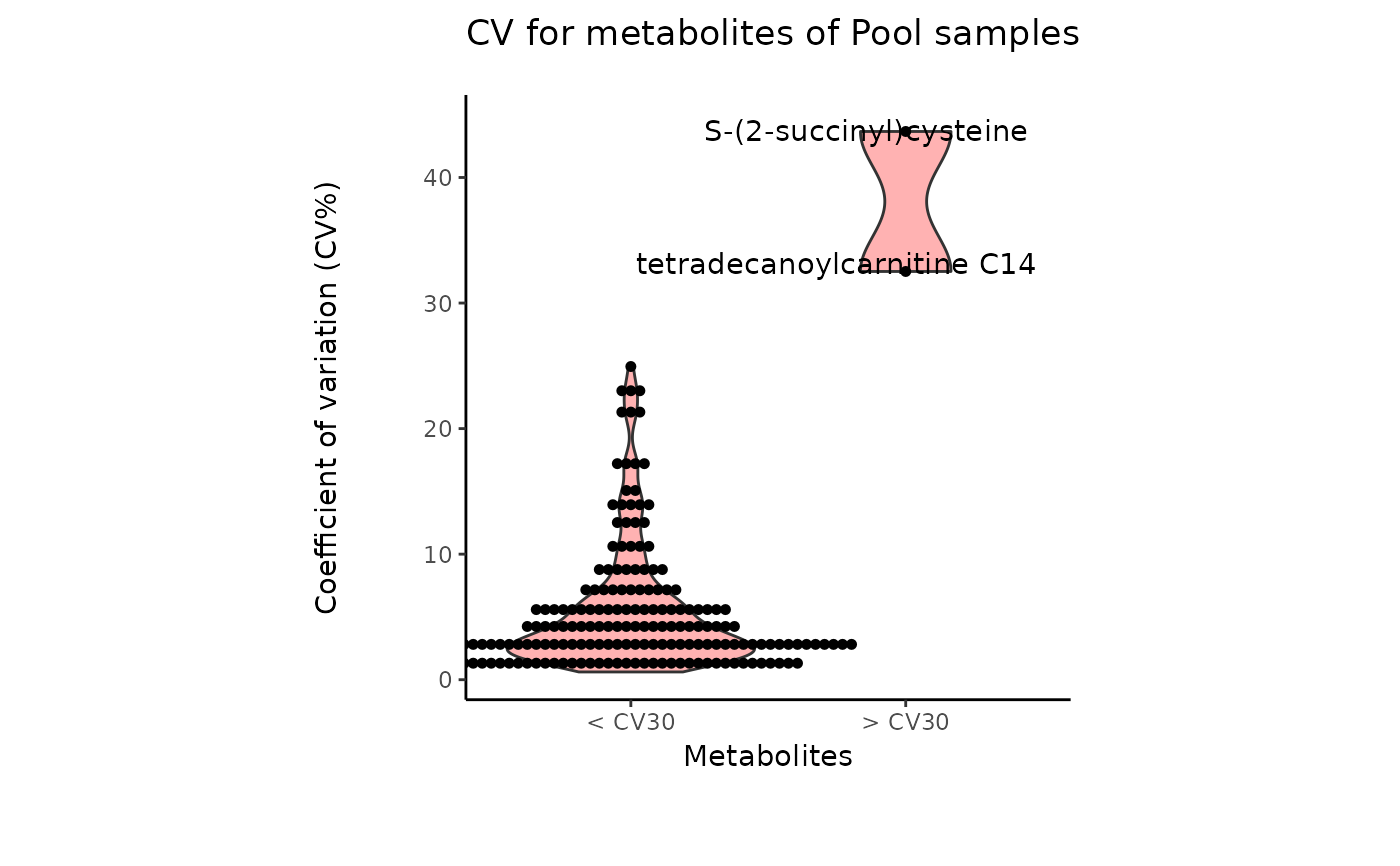
Find metabolites with high variability across total pool samples
Source:R/Processing.R
PoolEstimation.RdFind metabolites with high variability across total pool samples
Usage
PoolEstimation(
  InputData,
  SettingsFile_Sample = NULL,
  SettingsInfo = NULL,
  CutoffCV = 30,
  SaveAs_Plot = "svg",
  SaveAs_Table = "csv",
  PrintPlot = TRUE,
  FolderPath = NULL
)
Arguments
- InputData
DF which contains unique sample identifiers as row names and metabolite numerical values in columns with metabolite identifiers as column names. Use NA for metabolites that were not detected. Can be either a full dataset or a dataset with only the pool samples.
- SettingsFile_Sample
Optional: DF which contains information about the samples when a full dataset is inserted as Input_data. Column "Conditions" with information about the sample conditions (e.g. "N" and "T" or "Normal" and "Tumor"), has to exist.Default = NULL
- SettingsInfo
Optional: NULL or Named vector including the Conditions and PoolSample information (Name of the Conditions column and Name of the pooled samples in the Conditions in the Input_SettingsFile) : c(Conditions="ColumnNameConditions, PoolSamples=NamePoolCondition. If no Conditions is added in the Input_SettingsInfo, it is assumed that the conditions column is named 'Conditions' in the Input_SettingsFile. ). Default = NULL
- CutoffCV
Optional: Filtering cutoff for high variance metabolites using the Coefficient of Variation. Default = 30
- SaveAs_Plot
Optional: Select the file type of output plots. Options are svg, png, pdf or NULL. Default = svg
- SaveAs_Table
Optional: File types for the analysis results are: "csv", "xlsx", "txt", ot NULL default: "csv"
- PrintPlot
Optional: If TRUE prints an overview of resulting plots. Default = TRUE
- FolderPath
Optional: Path to the folder the results should be saved at. default: NULL


