Modularised Normalization: 80%-filtering rule, total-ion count normalization, missing value imputation and Outlier Detection: HotellingT2.
Source:R/Processing.R
PreProcessing.RdModularised Normalization: 80%-filtering rule, total-ion count normalization, missing value imputation and Outlier Detection: HotellingT2.
Usage
PreProcessing(
  InputData,
  SettingsFile_Sample,
  SettingsInfo,
  FeatureFilt = "Modified",
  FeatureFilt_Value = 0.8,
  TIC = TRUE,
  MVI = TRUE,
  MVI_Percentage = 50,
  HotellinsConfidence = 0.99,
  CoRe = FALSE,
  SaveAs_Plot = "svg",
  SaveAs_Table = "csv",
  PrintPlot = TRUE,
  FolderPath = NULL
)
Arguments
- InputData
DF which contains unique sample identifiers as row names and metabolite numerical values in columns with metabolite identifiers as column names. Use NA for metabolites that were not detected.
- SettingsFile_Sample
DF which contains information about the samples, which will be combined with the input data based on the unique sample identifiers used as rownames.
- SettingsInfo
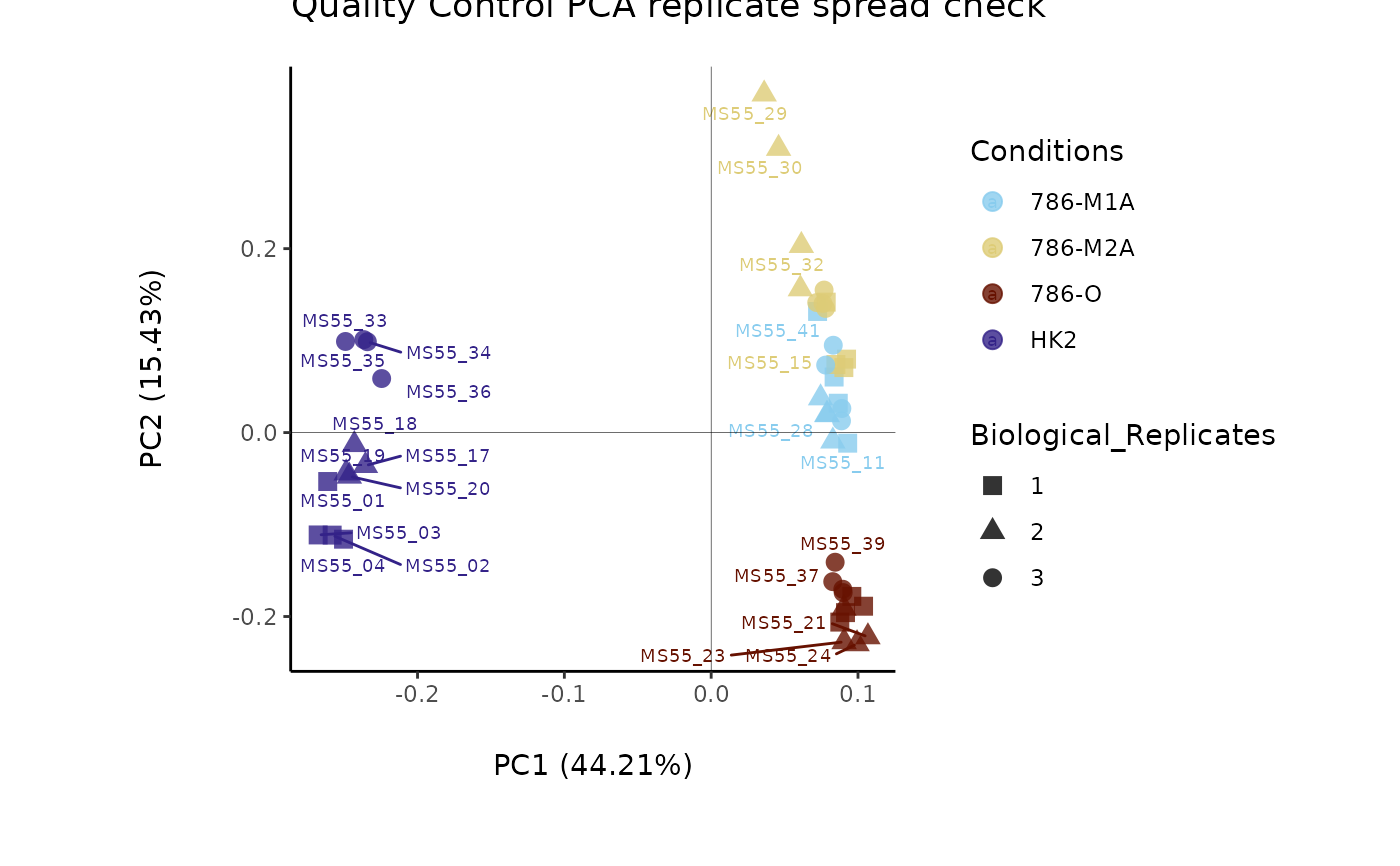
Named vector containing the information about the names of the experimental parameters. c(Conditions="ColumnName_Plot_SettingsFile", Biological_Replicates="ColumnName_Plot_SettingsFile"). Column "Conditions" with information about the sample conditions (e.g. "N" and "T" or "Normal" and "Tumor"), can be used for feature filtering and colour coding in the PCA. Column "BiologicalReplicates" including numerical values. For CoRe = TRUE a CoRe_norm_factor = "Columnname_Input_SettingsFile" and CoRe_media = "Columnname_Input_SettingsFile", have to also be added. Column CoRe_norm_factor is used for normalization and CoRe_media is used to specify the name of the media controls in the Conditions.
- FeatureFilt
Optional: If NULL, no feature filtering is performed. If set to "Standard" then it applies the 80%-filtering rule (Bijlsma S. et al., 2006) on the metabolite features on the whole dataset. If is set to "Modified",filtering is done based on the different conditions, thus a column named "Conditions" must be provided in the Input_SettingsFile input file including the individual conditions you want to apply the filtering to (Yang, J et al., 2015). Default = "Standard"
- FeatureFilt_Value
Optional: Percentage of feature filtering. Default = 0.8
- TIC
Optional: If TRUE, Total Ion Count normalization is performed. Default = TRUE
- MVI
Optional: If TRUE, Missing Value Imputation (MVI) based on half minimum is performed Default = TRUE
- MVI_Percentage
Optional: Percentage 0-100 of imputed value based on the minimum value. Default = 50
- HotellinsConfidence
Optional: Defines the Confidence of Outlier identification in HotellingT2 test. Must be numeric.Default = 0.99
- CoRe
Optional: If TRUE, a consumption-release experiment has been performed and the CoRe value will be calculated. Please consider providing a Normalisation factor column called "CoRe_norm_factor" in your "Input_SettingsFile" DF, where the column "Conditions" matches. The normalisation factor must be a numerical value obtained from growth rate that has been obtained from a growth curve or growth factor that was obtained by the ratio of cell count/protein quantification at the start point to cell count/protein quantification at the end point.. Additionally control media samples have to be available in the "Input" DF and defined as "CoRe_media" samples in the "Conditions" column in the "Input_SettingsFile" DF. Default = FALSE
- SaveAs_Plot
Optional: Select the file type of output plots. Options are svg, png, pdf. If set to NULL, plots are not saved. Default = svg
- SaveAs_Table
Optional: Select the file type of output table. Options are "csv", "xlsx", "txt". If set to NULL, plots are not saved. Default = "csv"
- PrintPlot
Optional: If TRUE prints an overview of resulting plots. Default = TRUE
- FolderPath
Optional: Path to the folder the results should be saved at. default: NULL
Value
List with two elements: DF (including all output tables generated) and Plot (including all plots generated)
Examples
Intra <- MetaProViz::ToyData("IntraCells_Raw")
ResI <- MetaProViz::PreProcessing(InputData=Intra[-c(49:58) ,-c(1:3)],
SettingsFile_Sample=Intra[-c(49:58) , c(1:3)],
SettingsInfo = c(Conditions = "Conditions", Biological_Replicates = "Biological_Replicates"))
#> FeatureFiltering: Here we apply the modified 80%-filtering rule that takes the class information (Column `Conditions`) into account, which additionally reduces the effect of missing values (REF: Yang et. al., (2015), doi: 10.3389/fmolb.2015.00004). Filtering value selected: 0.8
#> 3 metabolites where removed: AICAR, FAICAR, SAICAR
#> Missing Value Imputation: Missing value imputation is performed, as a complementary approach to address the missing value problem, where the missing values are imputing using the `half minimum value`. REF: Wei et. al., (2018), Reports, 8, 663, doi:https://doi.org/10.1038/s41598-017-19120-0
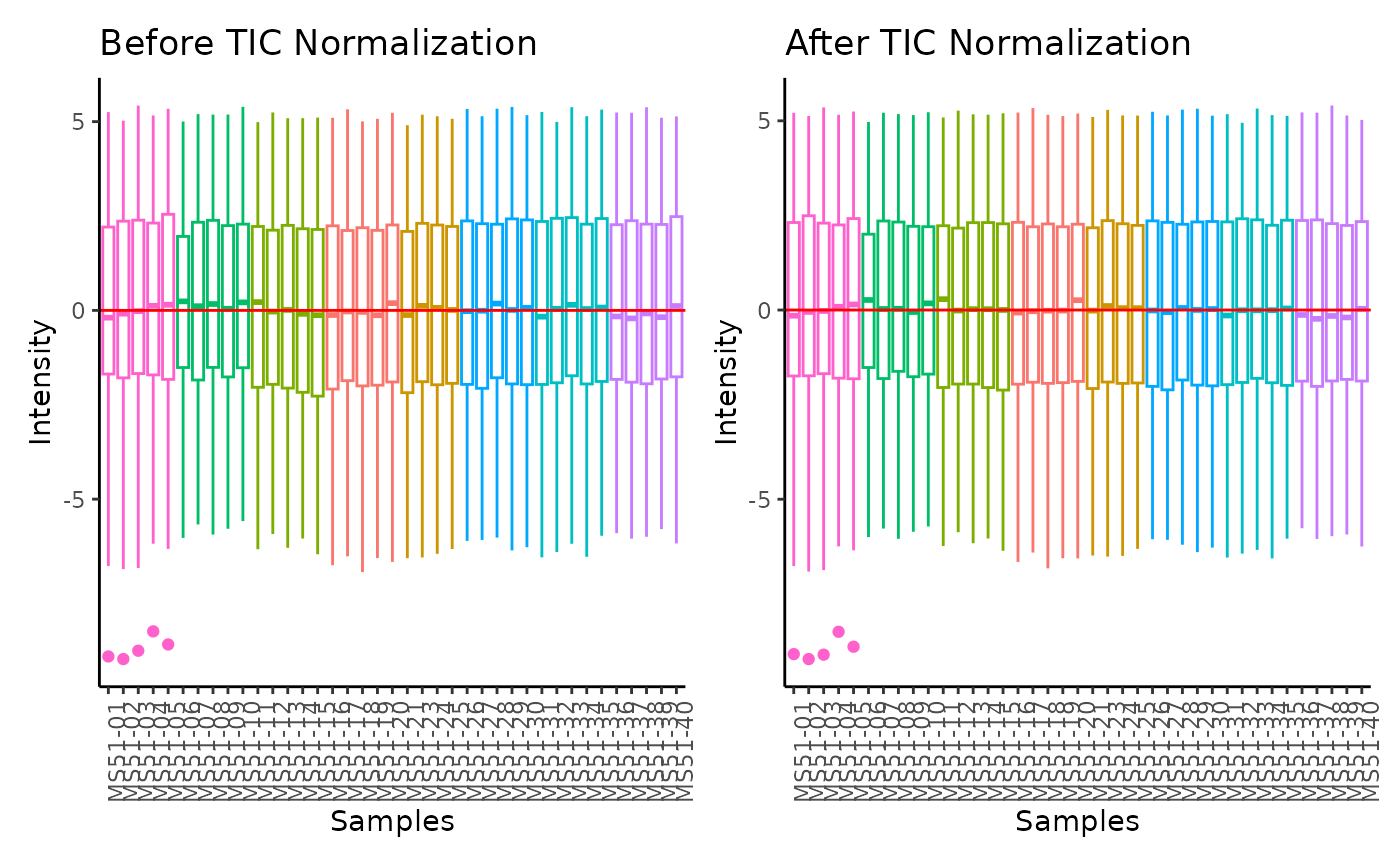
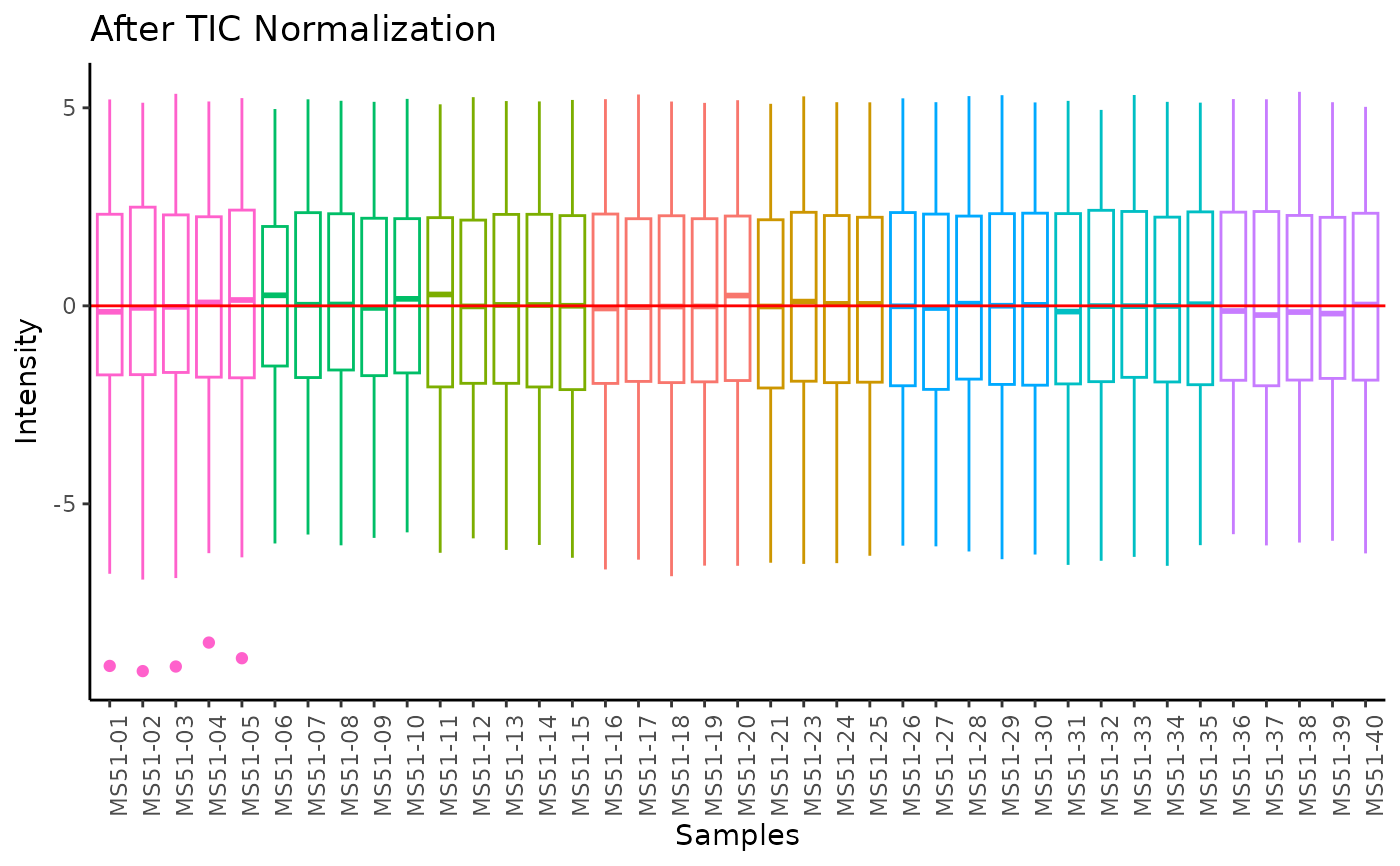
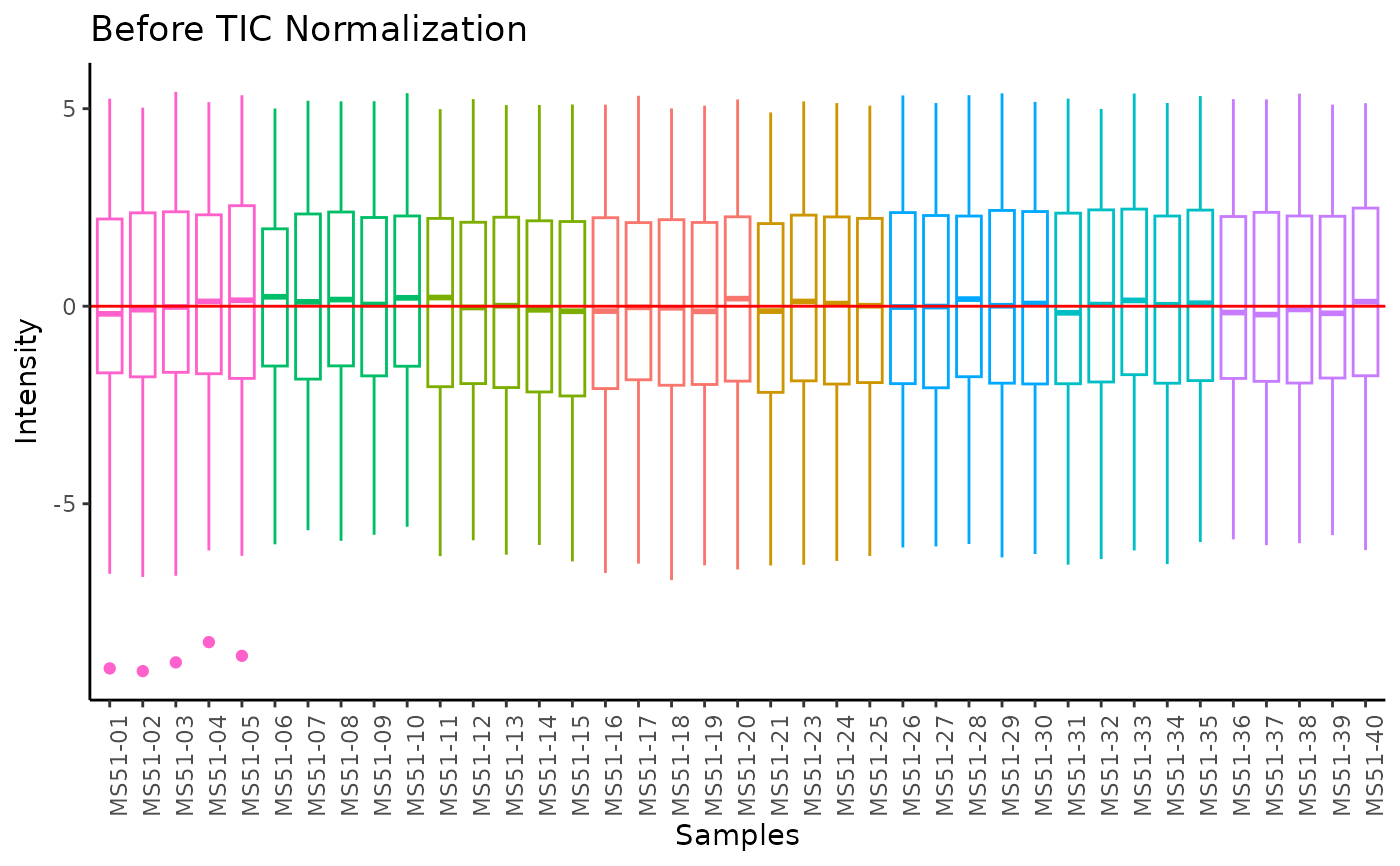
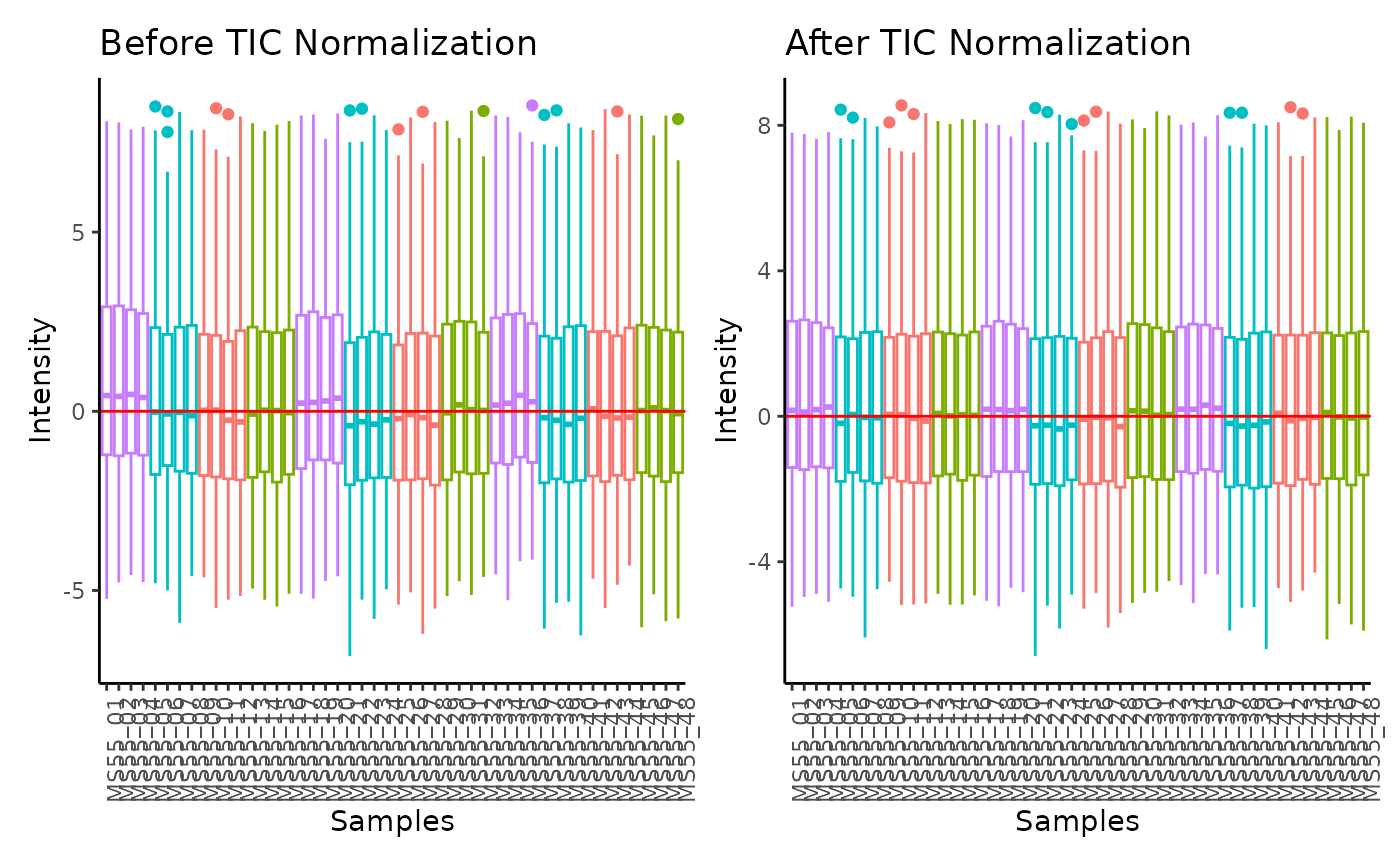
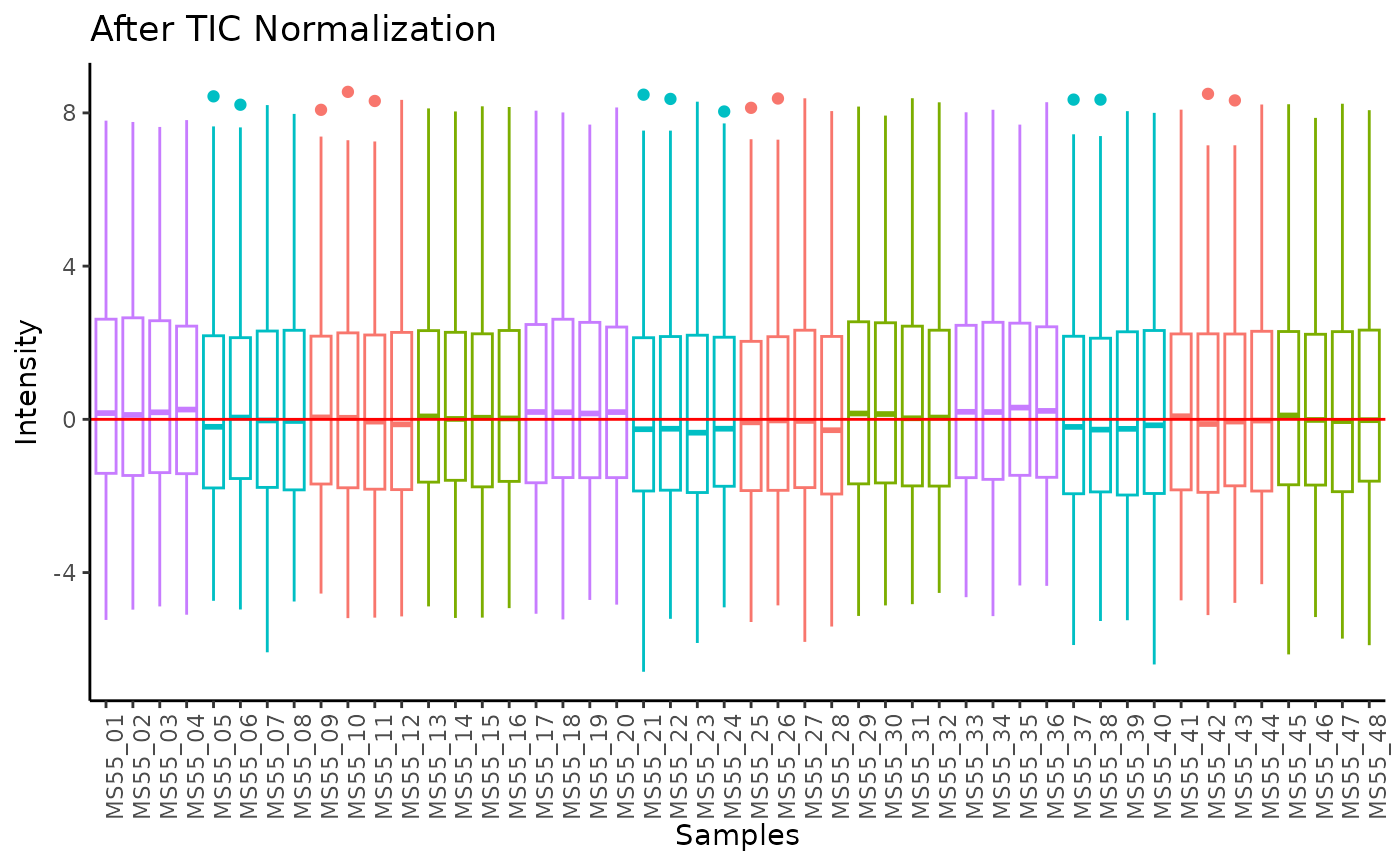
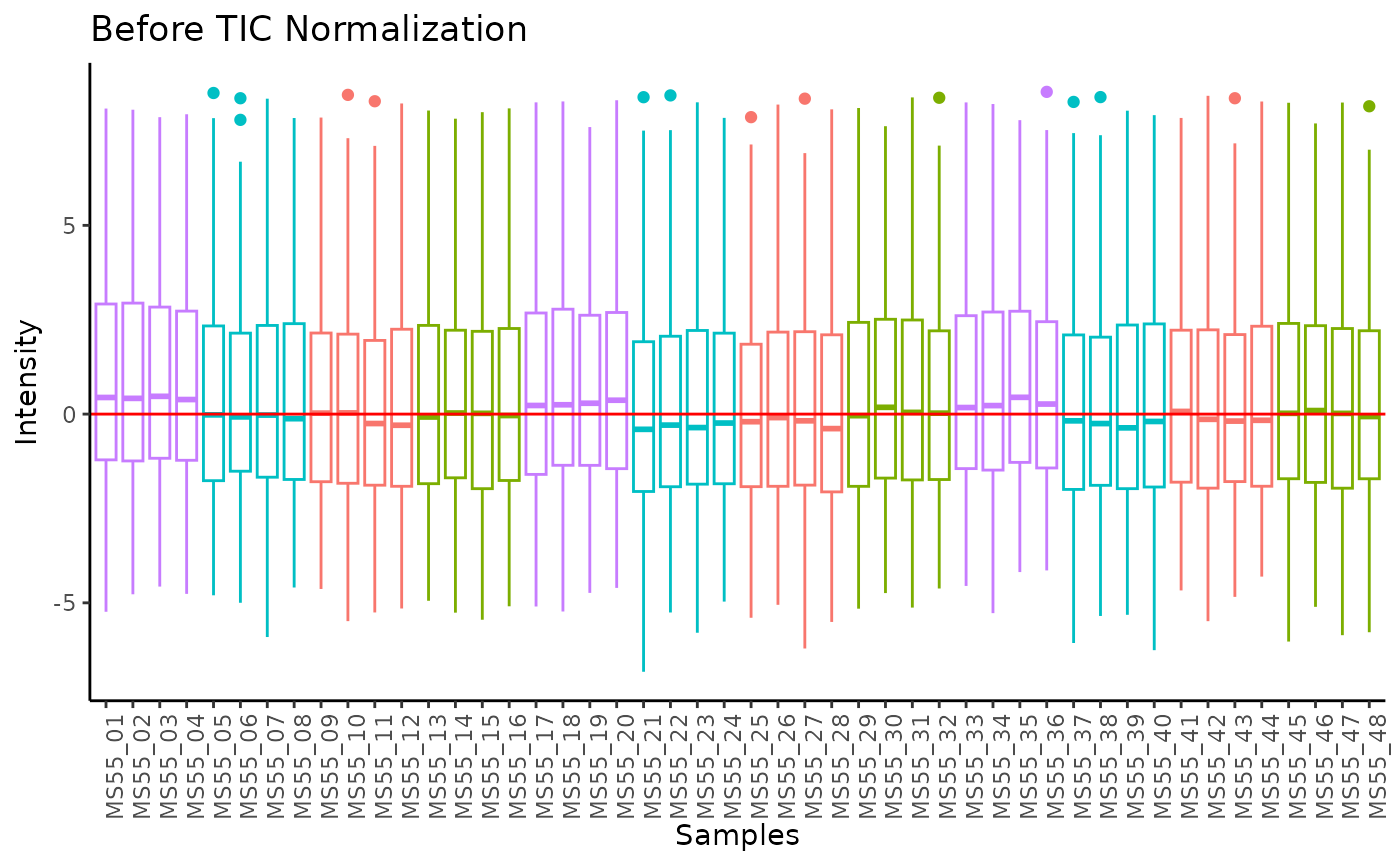
#> Total Ion Count (TIC) normalization: Total Ion Count (TIC) normalization is used to reduce the variation from non-biological sources, while maintaining the biological variation. REF: Wulff et. al., (2018), Advances in Bioscience and Biotechnology, 9, 339-351, doi:https://doi.org/10.4236/abb.2018.98022
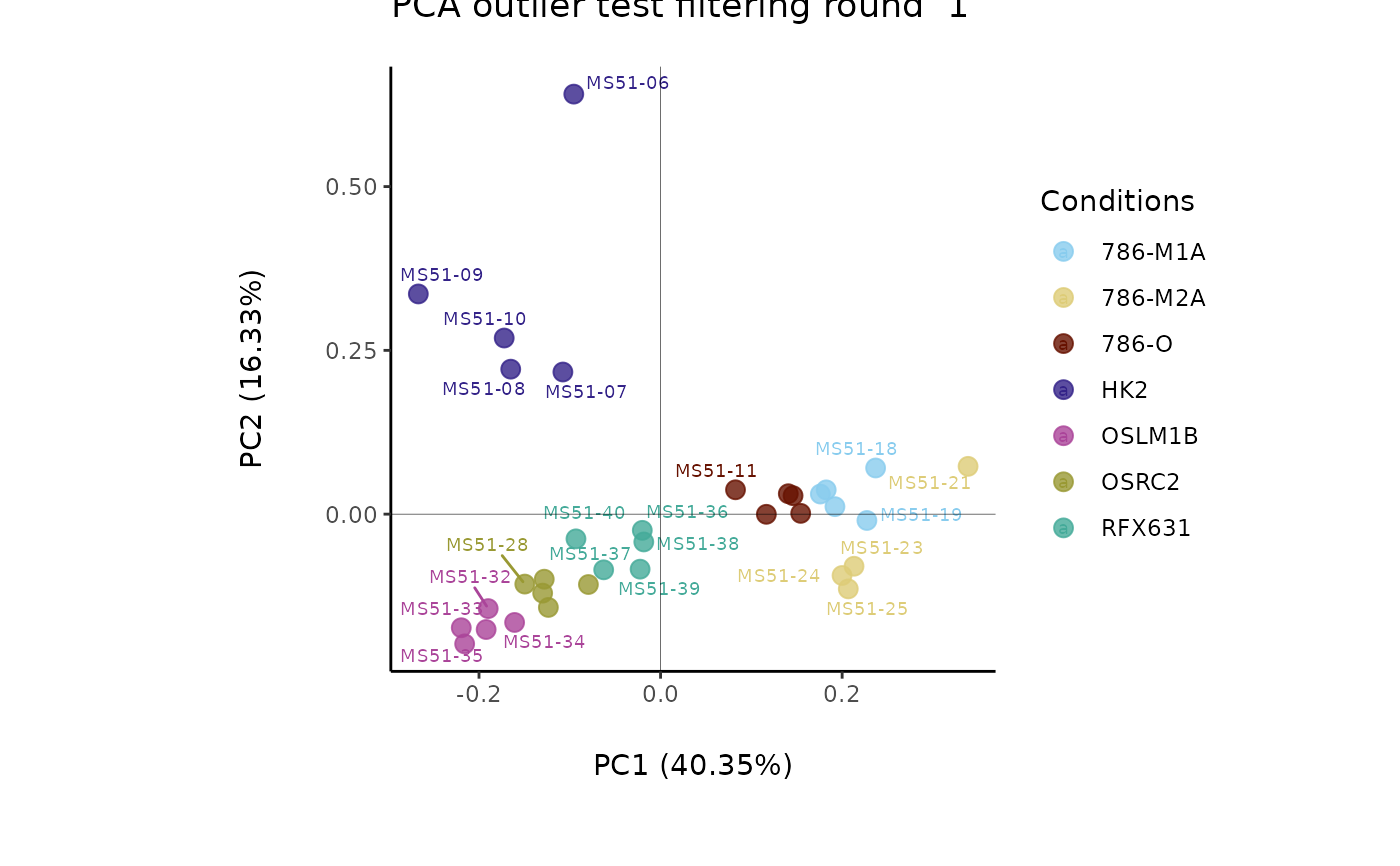
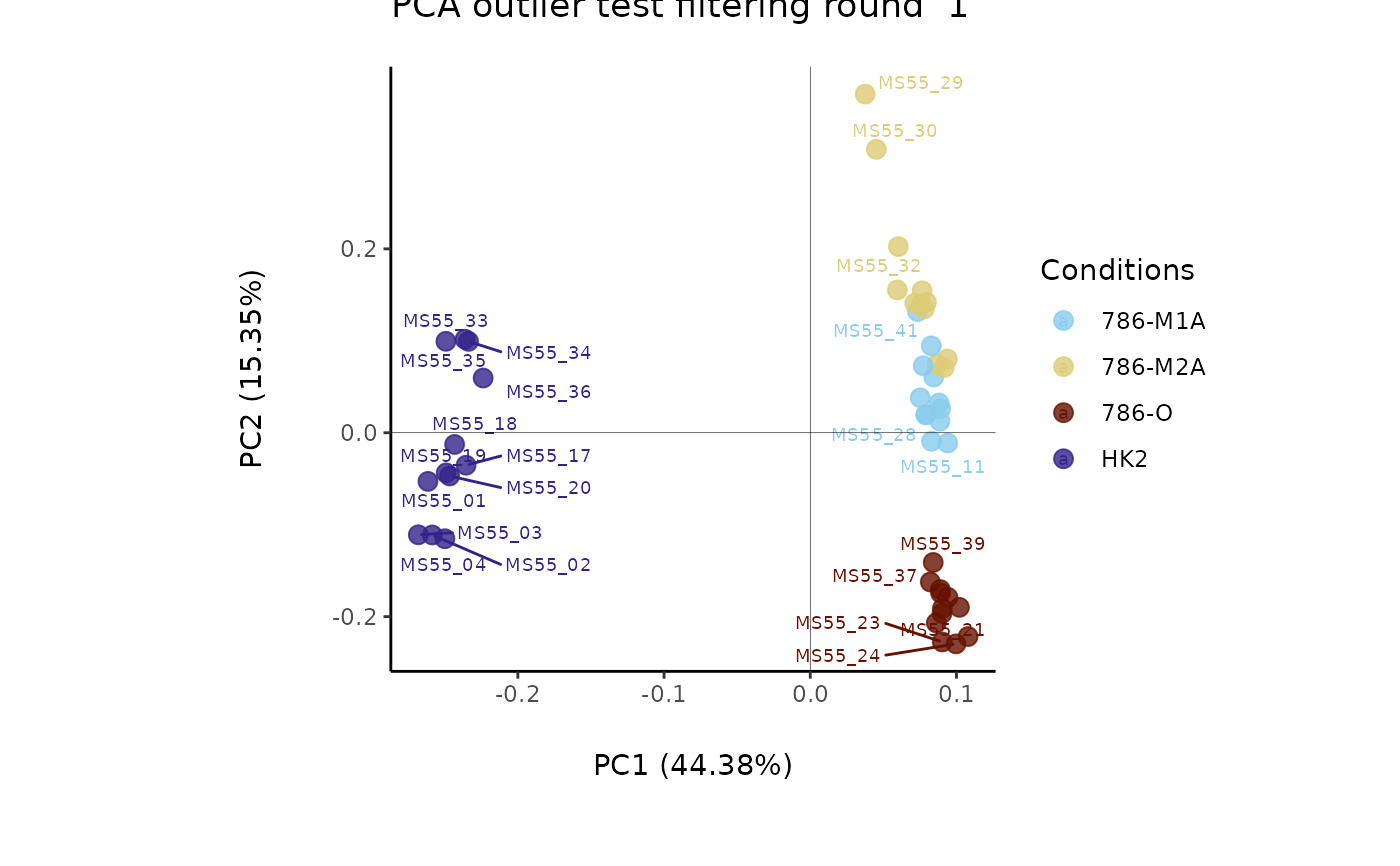
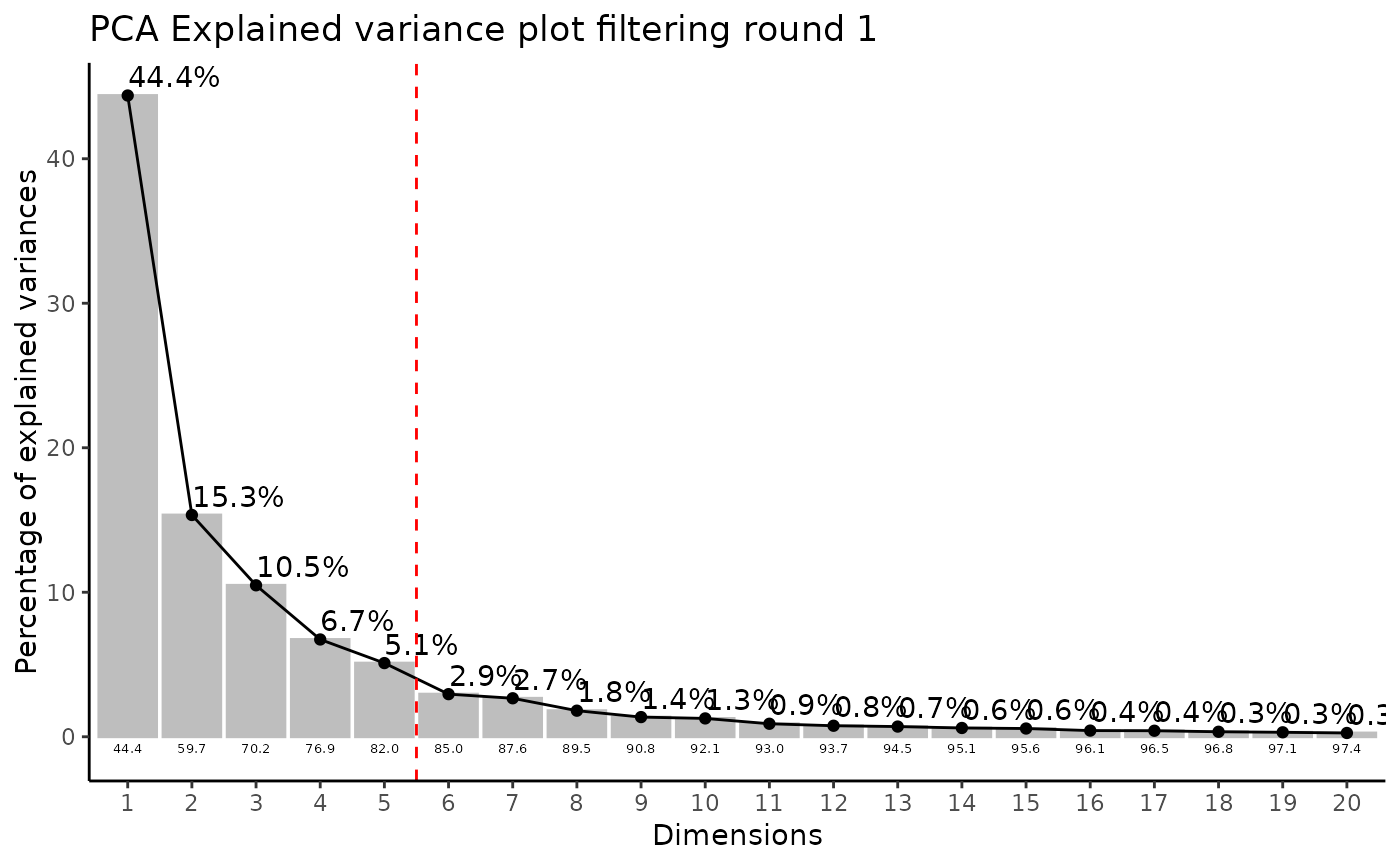
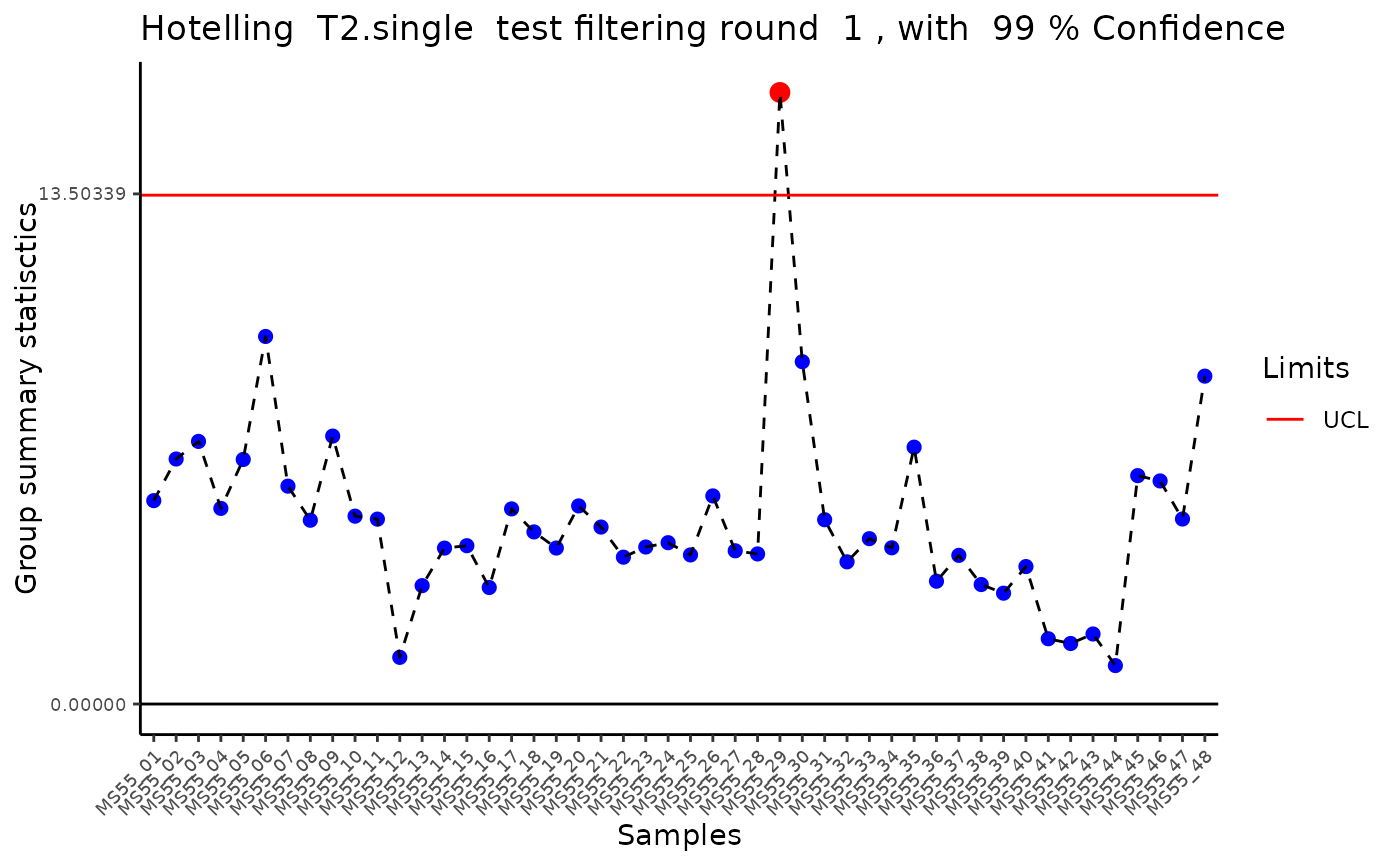
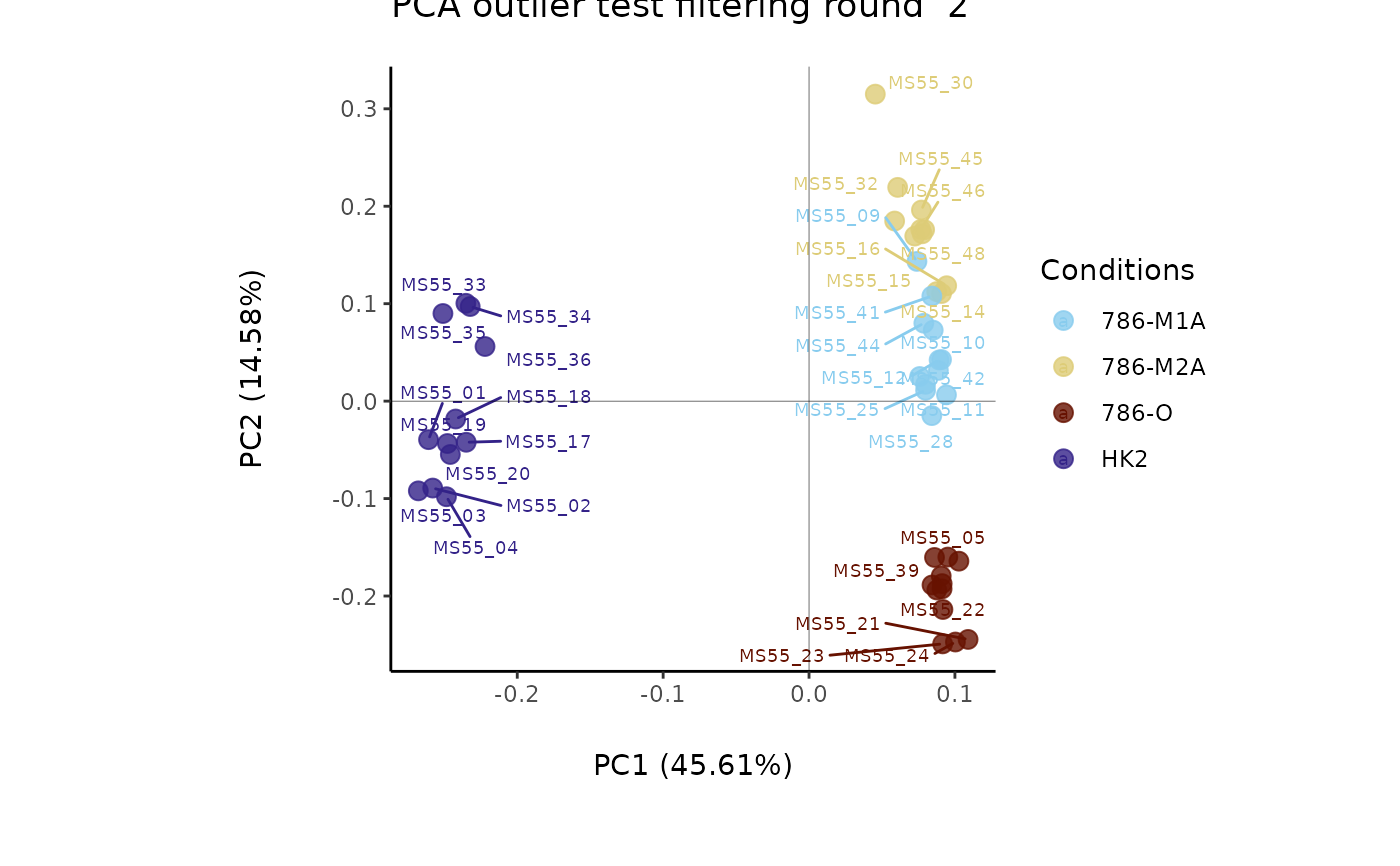
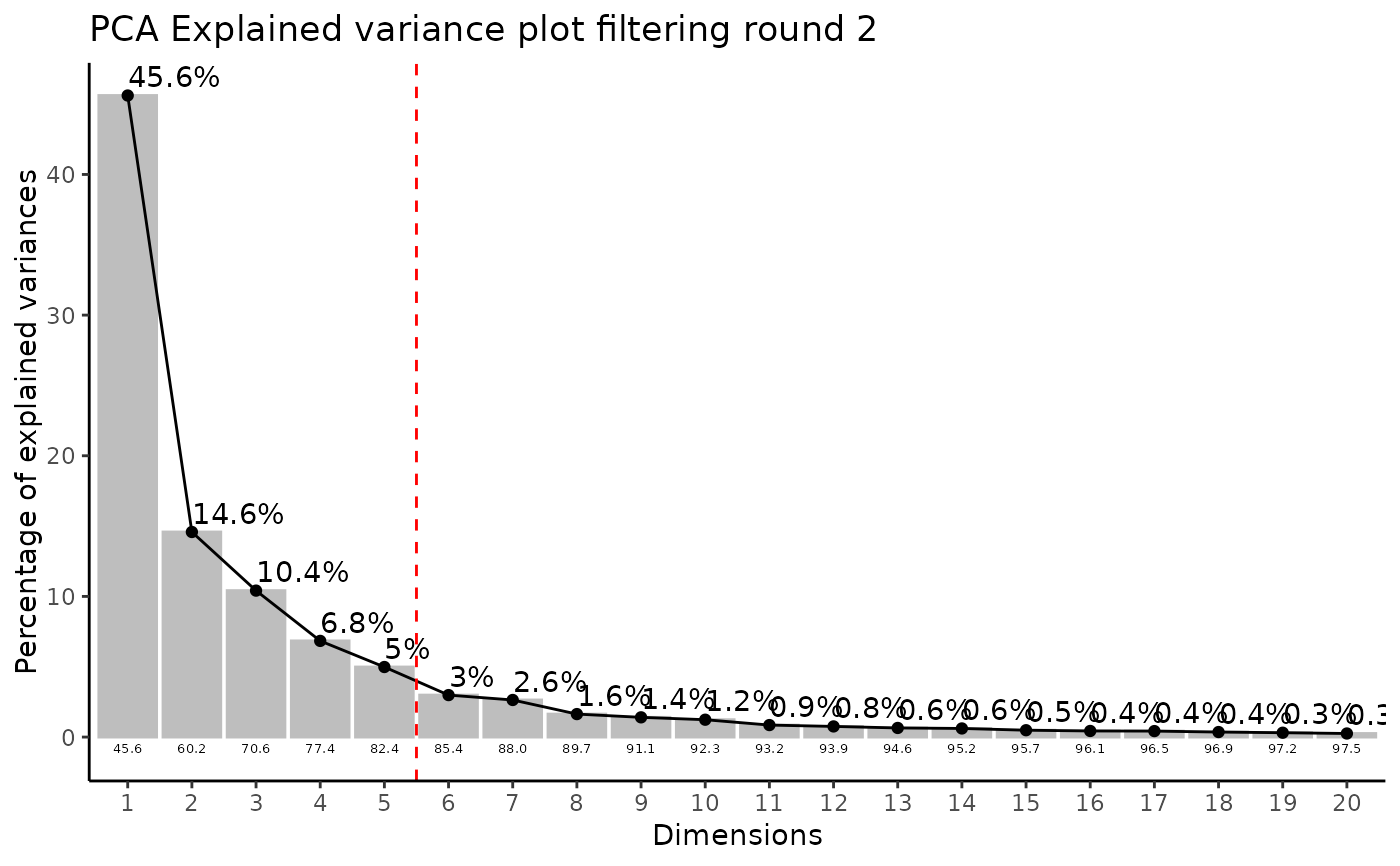
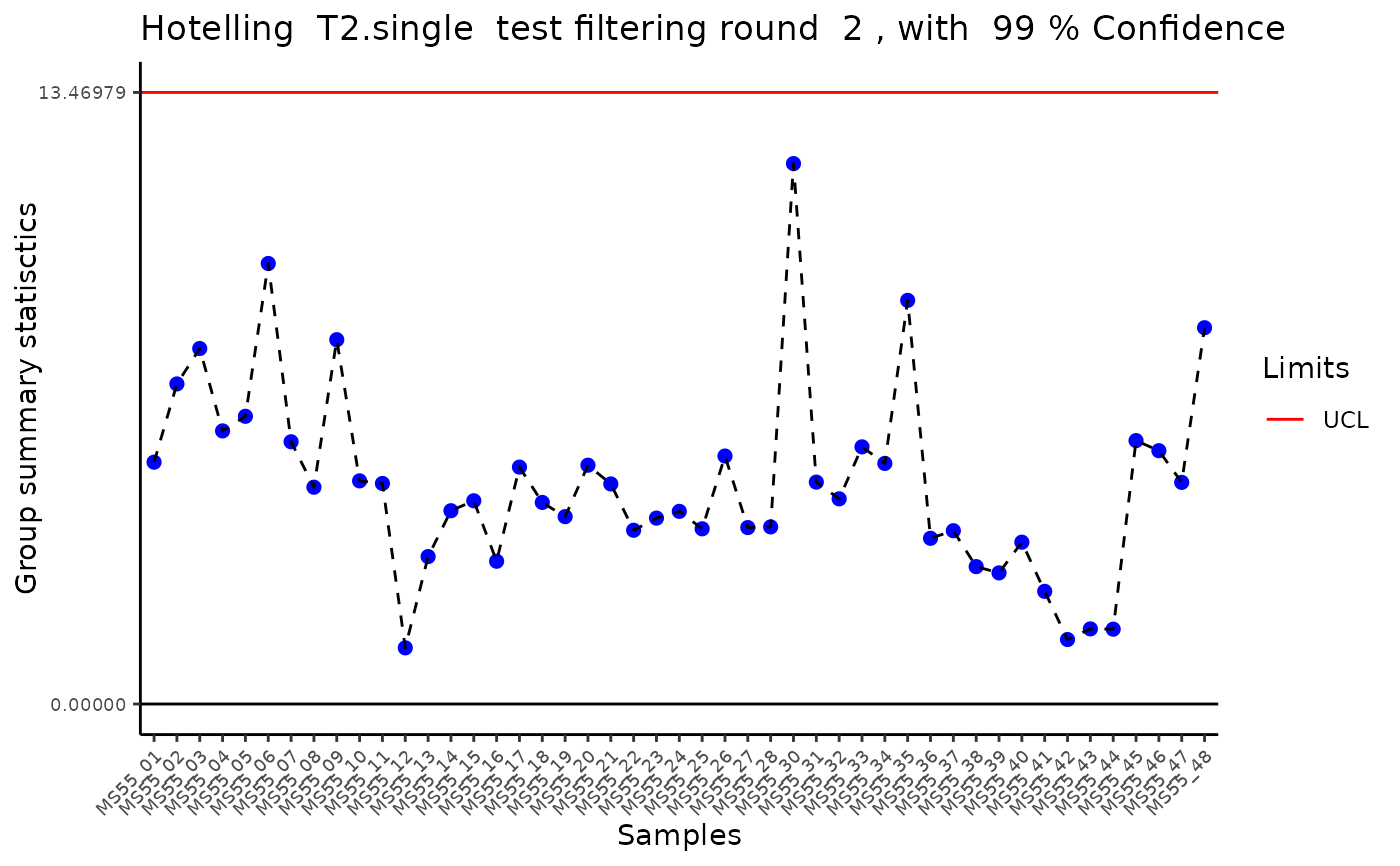
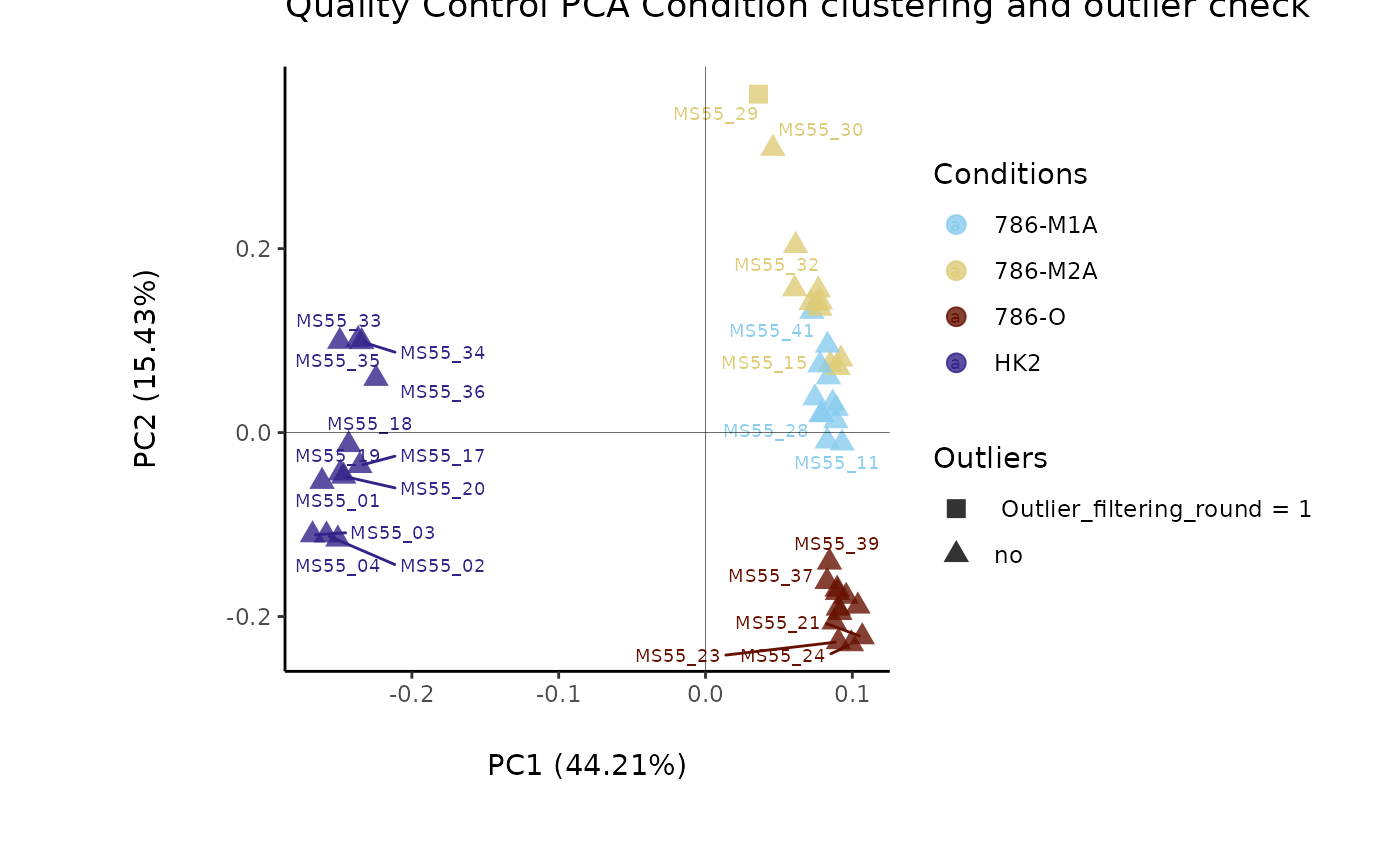
#> Outlier detection: Identification of outlier samples is performed using Hotellin's T2 test to define sample outliers in a mathematical way (Confidence = 0.99 ~ p.val < 0.01) (REF: Hotelling, H. (1931), Annals of Mathematical Statistics. 2 (3), 360-378, doi:https://doi.org/10.1214/aoms/1177732979). HotellinsConfidence value selected: 0.99
#> There are possible outlier samples in the data
#> Filtering round 1 Outlier Samples: MS55_29
 Media <- MetaProViz::ToyData("CultureMedia_Raw")
ResM <- MetaProViz::PreProcessing(InputData = Media[-c(40:45) ,-c(1:3)],
SettingsFile_Sample = Media[-c(40:45) ,c(1:3)] ,
SettingsInfo = c(Conditions = "Conditions", Biological_Replicates = "Biological_Replicates", CoRe_norm_factor = "GrowthFactor", CoRe_media = "blank"),
CoRe=TRUE)
#> For Consumption Release experiment we are using the method from Jain M. REF: Jain et. al, (2012), Science 336(6084):1040-4, doi: 10.1126/science.1218595.
#> FeatureFiltering: Here we apply the modified 80%-filtering rule that takes the class information (Column `Conditions`) into account, which additionally reduces the effect of missing values (REF: Yang et. al., (2015), doi: 10.3389/fmolb.2015.00004). Filtering value selected: 0.8
#> 3 metabolites where removed: N-acetylaspartylglutamate, hypotaurine, S-(2-succinyl)cysteine
#> Missing Value Imputation: Missing value imputation is performed, as a complementary approach to address the missing value problem, where the missing values are imputing using the `half minimum value`. REF: Wei et. al., (2018), Reports, 8, 663, doi:https://doi.org/10.1038/s41598-017-19120-0
#> NA values were found in Control_media samples for metabolites. For metabolites including NAs MVI is performed unless all samples of a metabolite are NA.
#> Metabolites with high NA load (>20%) in Control_media samples are: dihydroorotate.
#> Metabolites with only NAs (=100%) in Control_media samples are: hydroxyphenylpyruvate. Those NAs are set zero as we consider them true zeros
#> Total Ion Count (TIC) normalization: Total Ion Count (TIC) normalization is used to reduce the variation from non-biological sources, while maintaining the biological variation. REF: Wulff et. al., (2018), Advances in Bioscience and Biotechnology, 9, 339-351, doi:https://doi.org/10.4236/abb.2018.98022
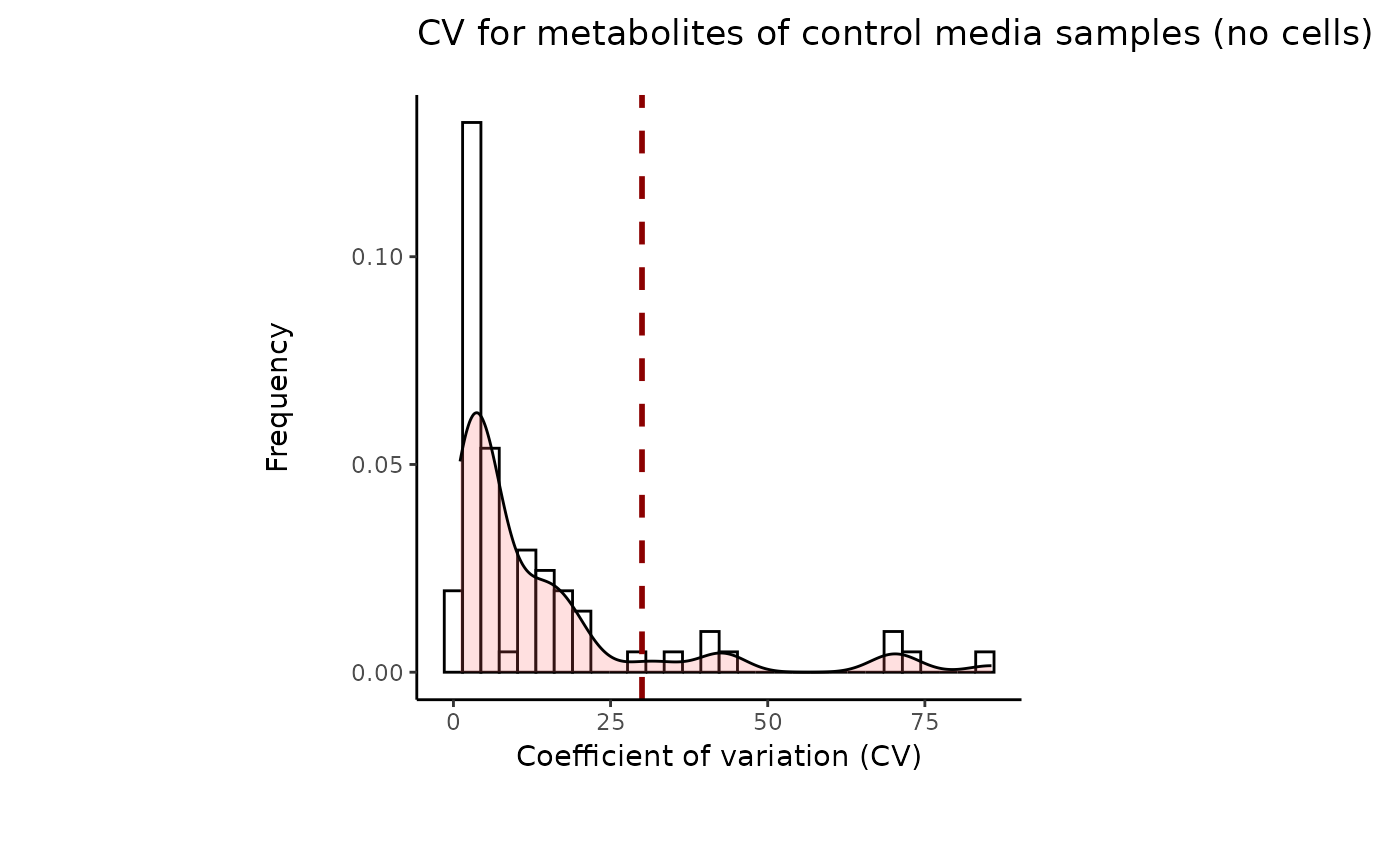
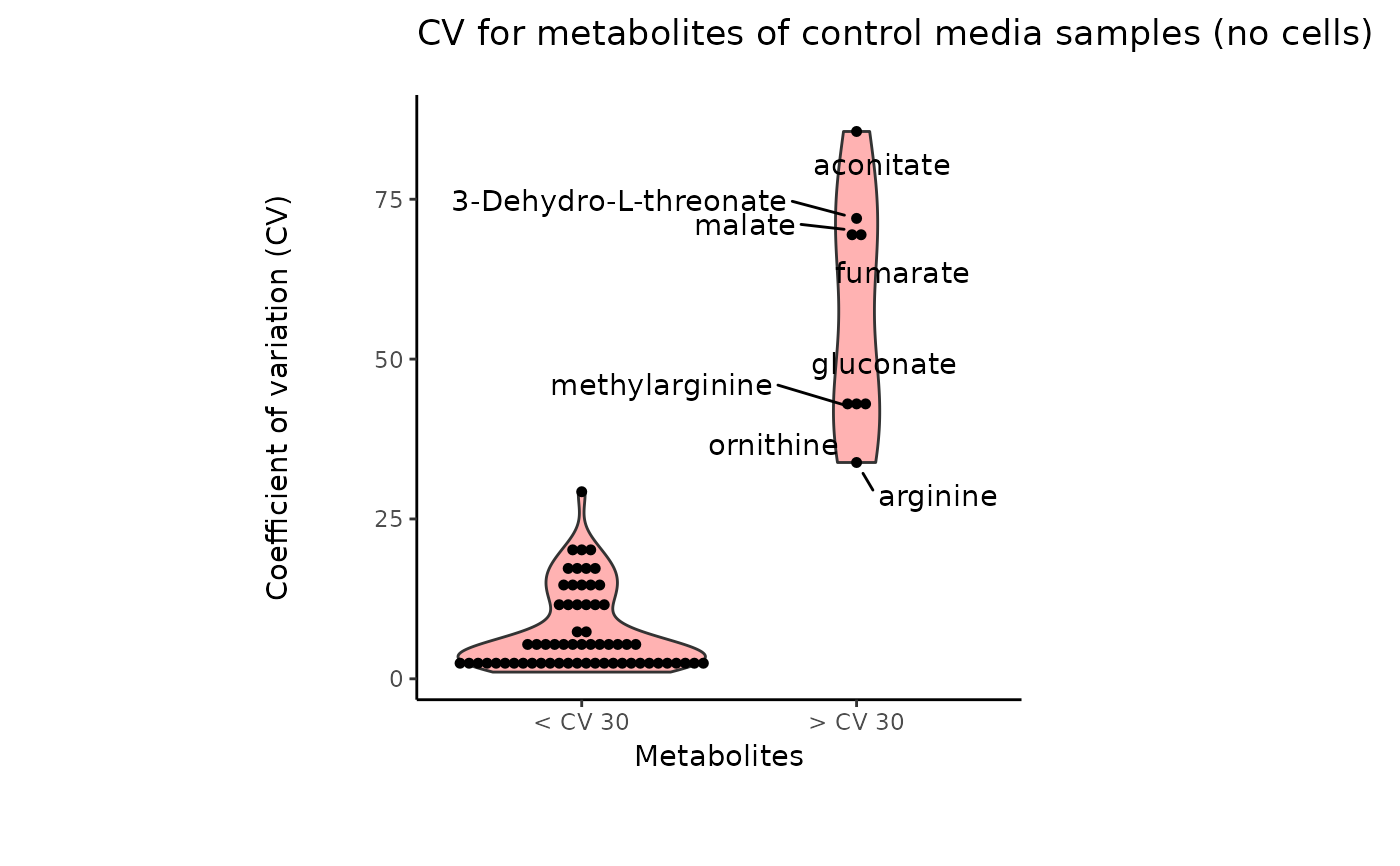
#> 8 of variables have high variability (CV > 30) in the CoRe_media control samples. Consider checking the pooled samples to decide whether to remove these metabolites or not.
#> Warning: The CoRe_media samples MS51-06 were found to be different from the rest. They will not be included in the sum of the CoRe_media samples.
#> CoRe data are normalised by substracting mean (blank) from each sample and multiplying with the CoRe_norm_factor
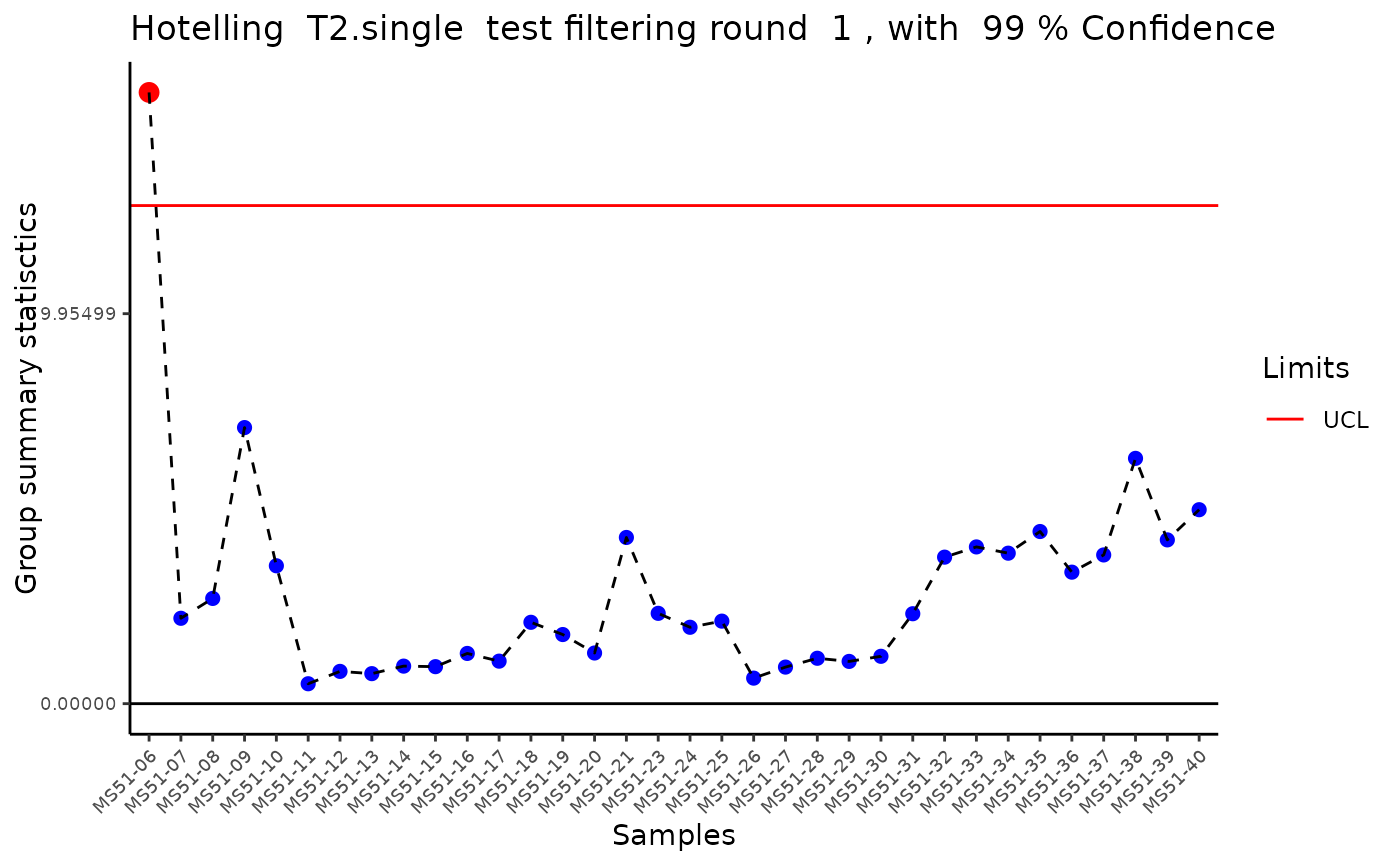
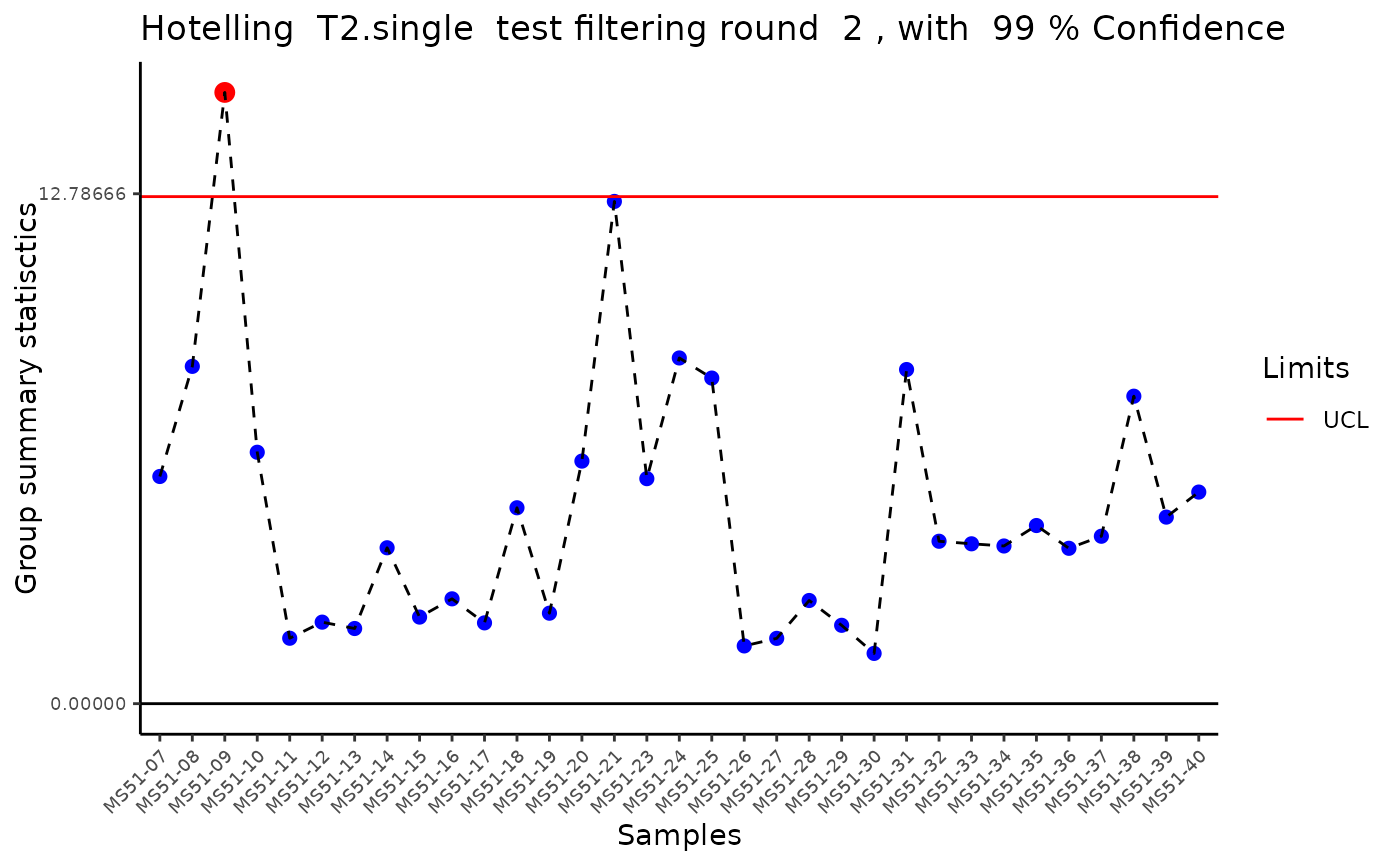
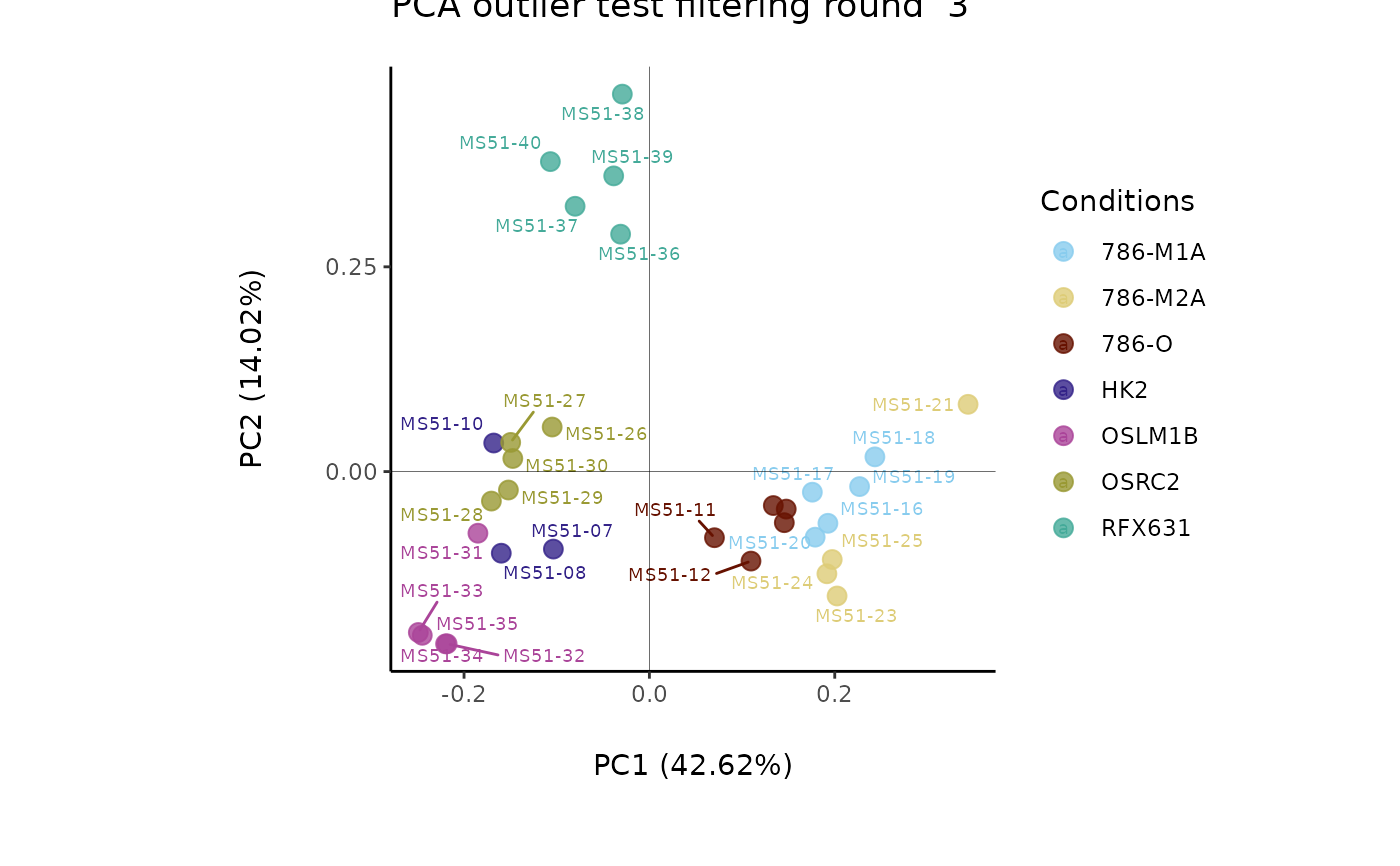
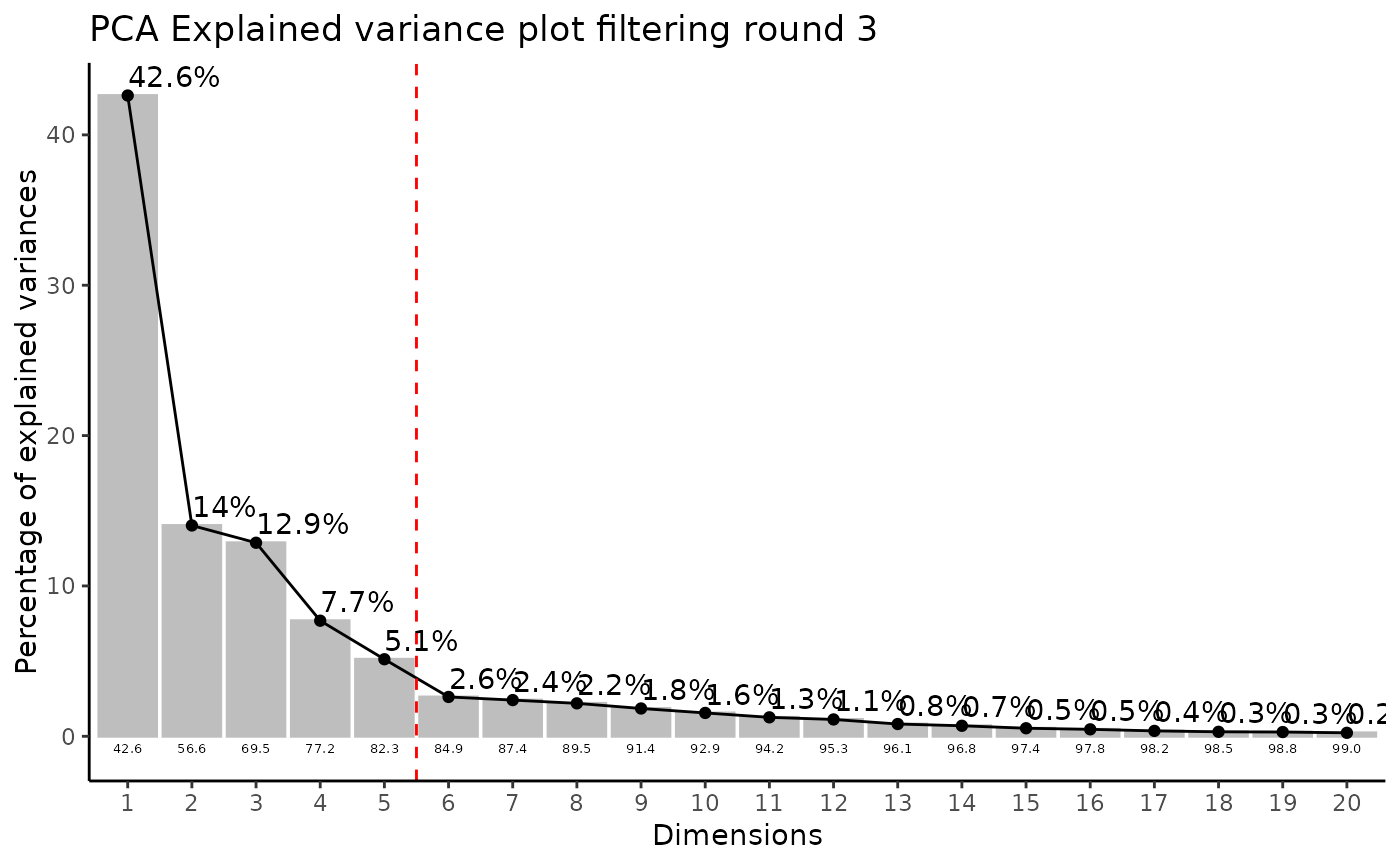
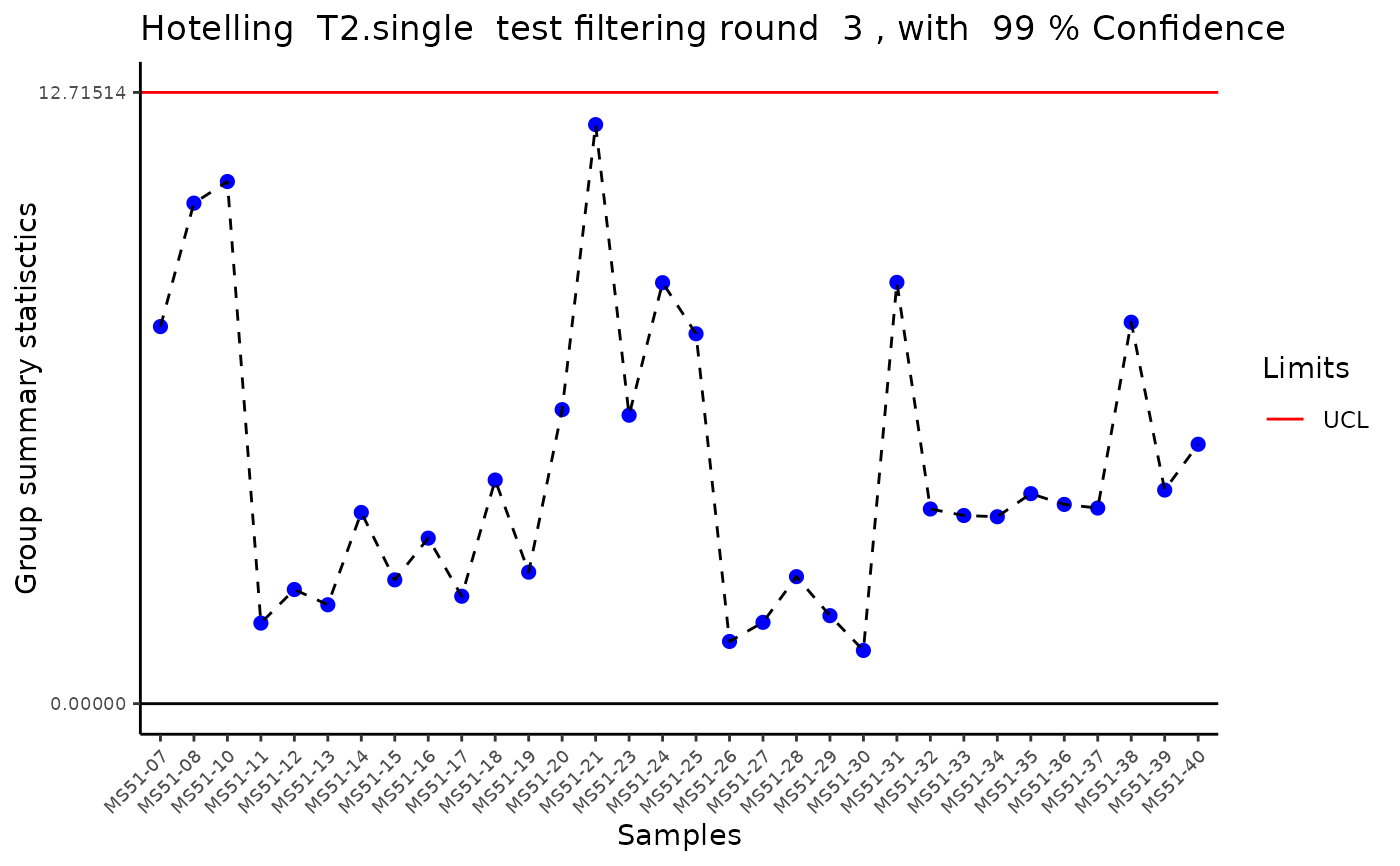
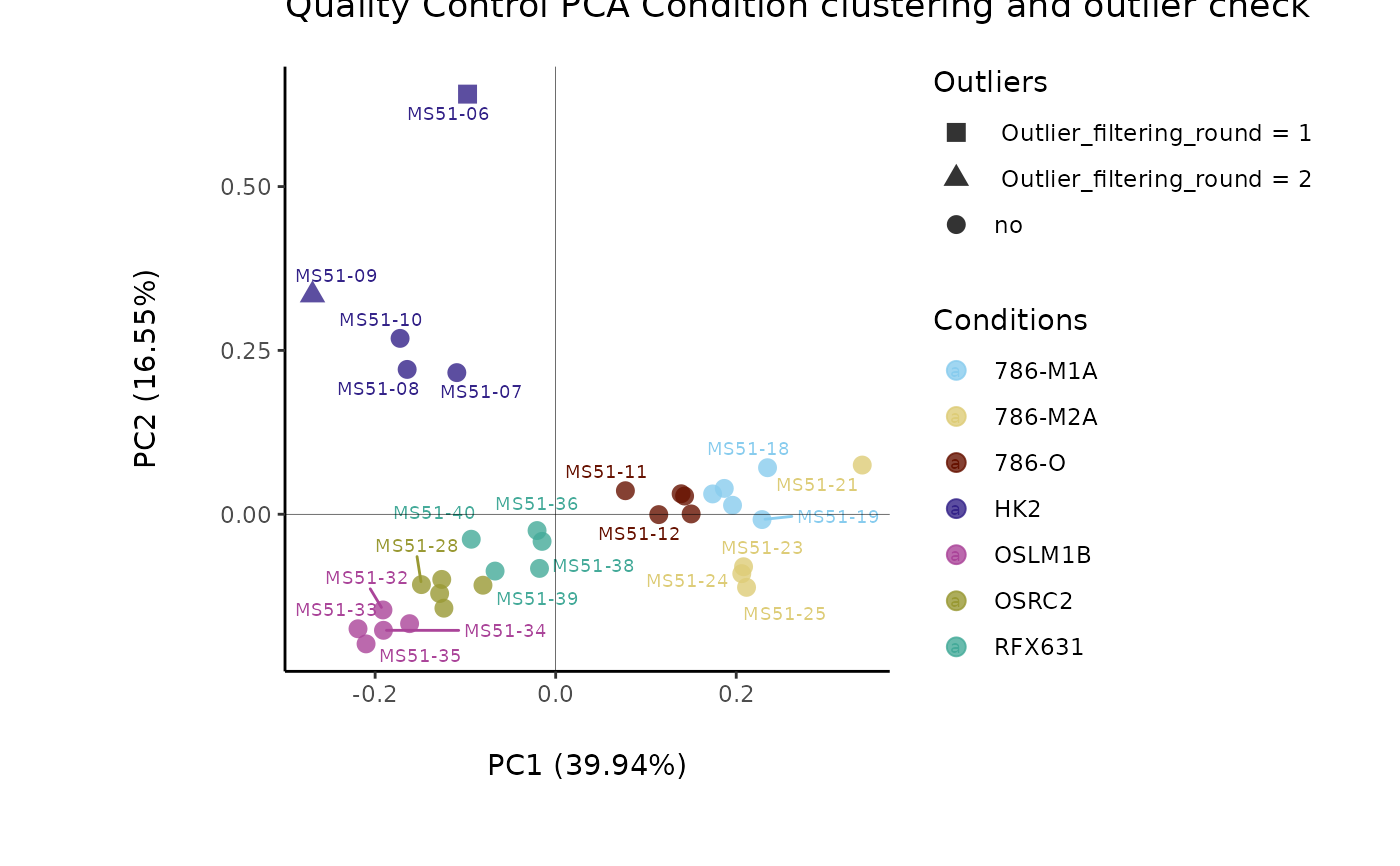
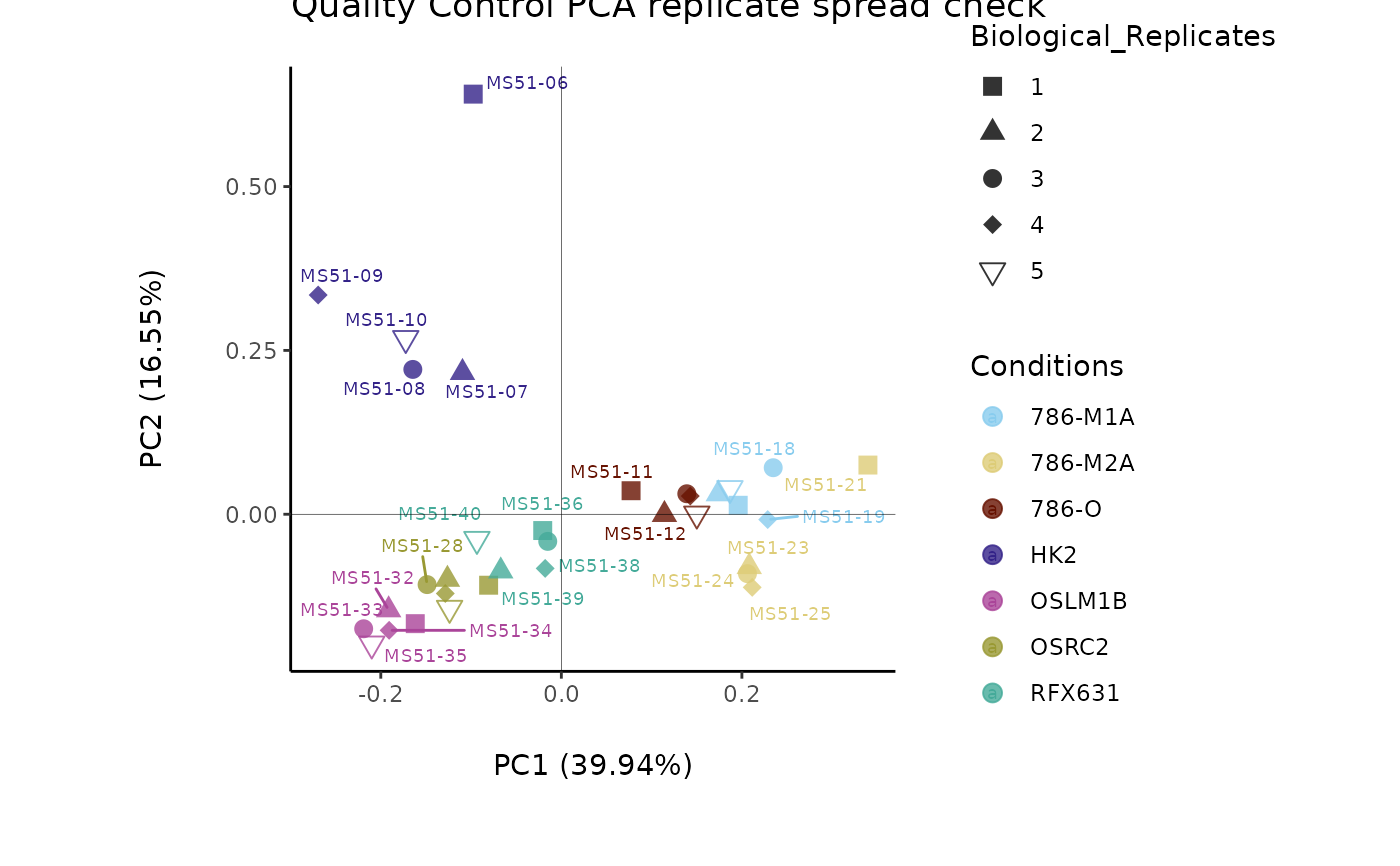
#> Outlier detection: Identification of outlier samples is performed using Hotellin's T2 test to define sample outliers in a mathematical way (Confidence = 0.99 ~ p.val < 0.01) (REF: Hotelling, H. (1931), Annals of Mathematical Statistics. 2 (3), 360-378, doi:https://doi.org/10.1214/aoms/1177732979). HotellinsConfidence value selected: 0.99
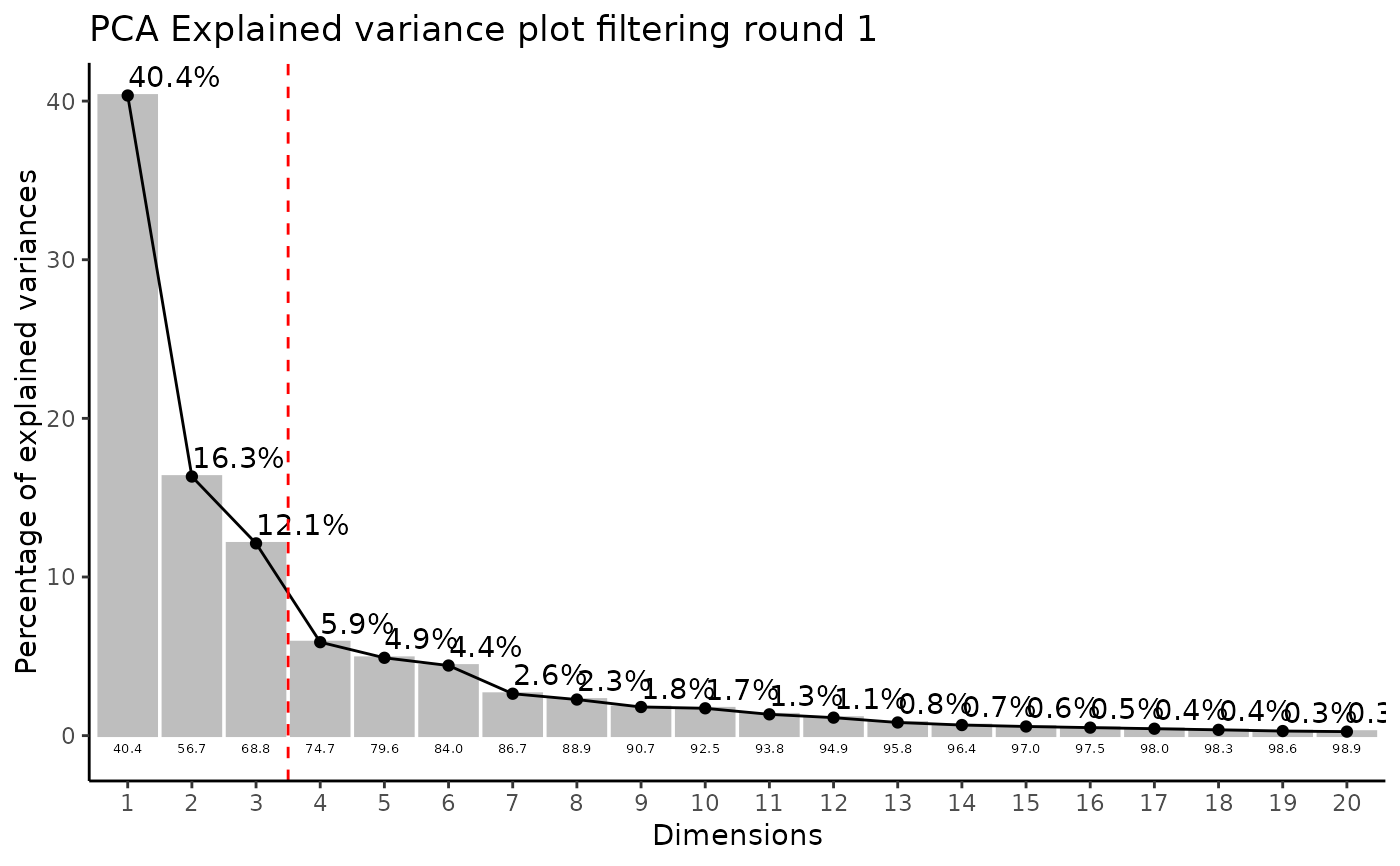
#> There are possible outlier samples in the data
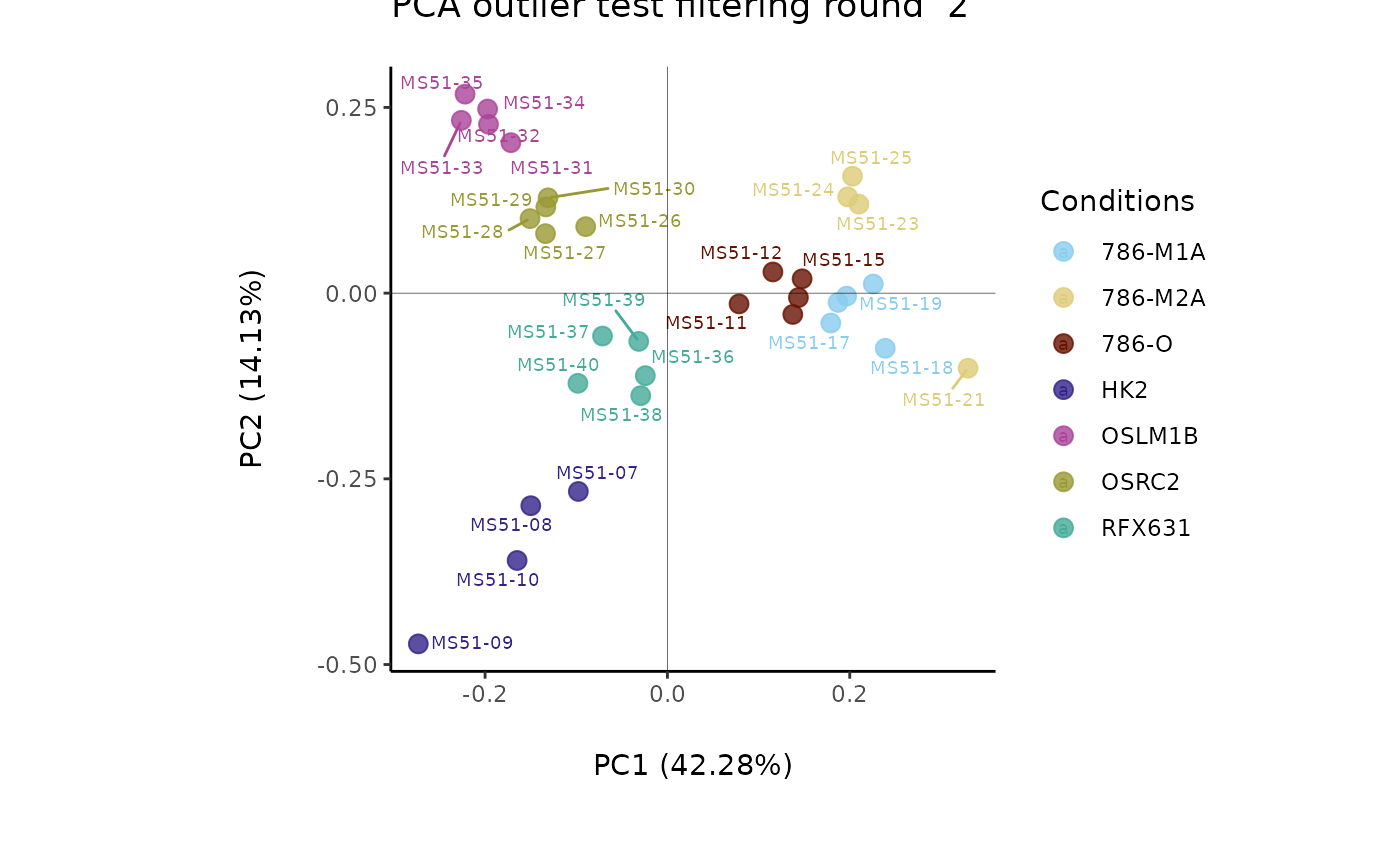
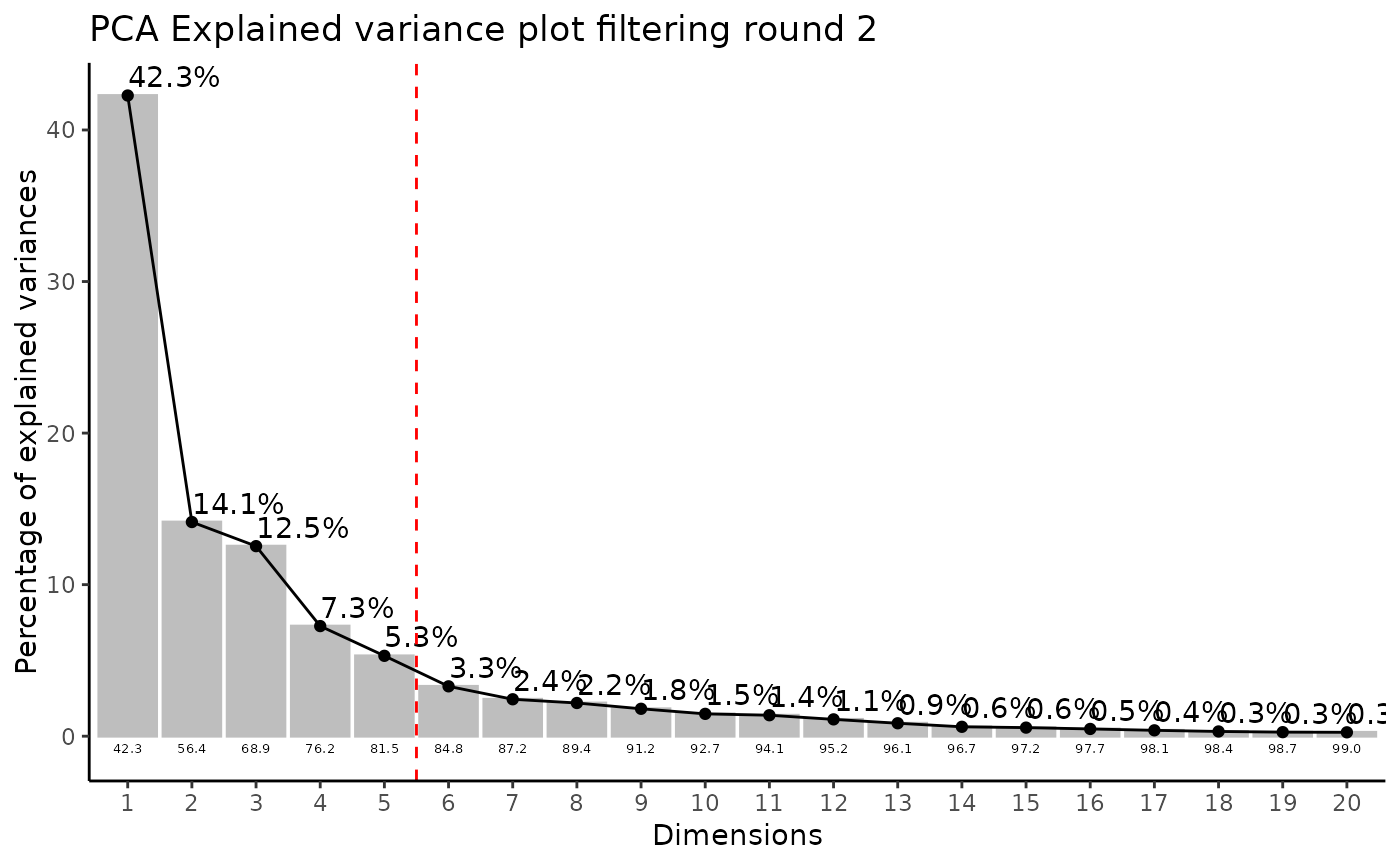
#> Filtering round 1 Outlier Samples: MS51-06
#> Filtering round 2 Outlier Samples: MS51-09
