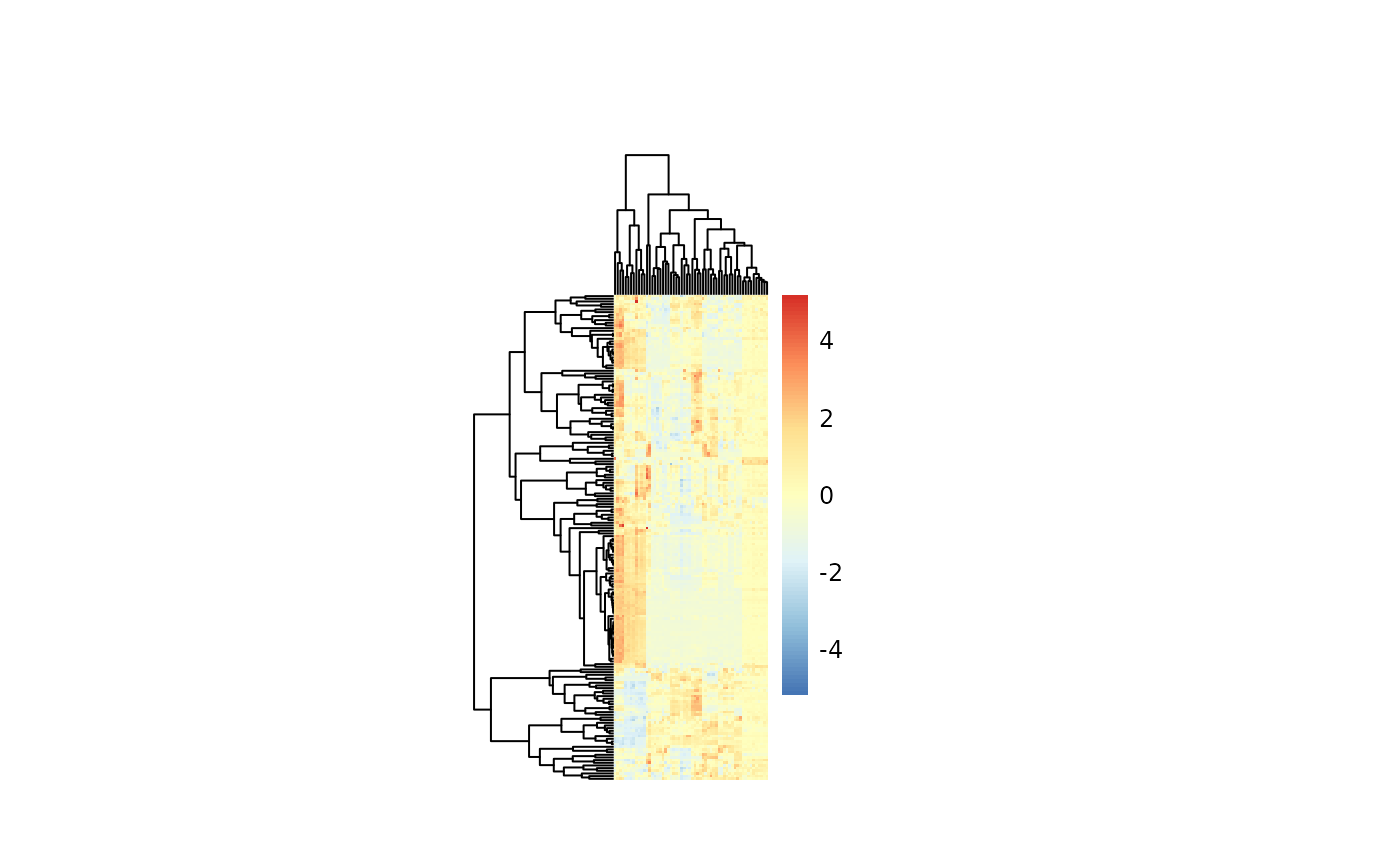
Heatmap visualization
Usage
VizHeatmap(
  InputData,
  SettingsInfo = NULL,
  SettingsFile_Sample = NULL,
  SettingsFile_Metab = NULL,
  PlotName = "",
  Scale = "row",
  SaveAs_Plot = "svg",
  Enforce_FeatureNames = FALSE,
  Enforce_SampleNames = FALSE,
  PrintPlot = TRUE,
  FolderPath = NULL
)
Arguments
- InputData
DF with unique sample identifiers as row names and metabolite numerical values in columns with metabolite identifiers as column names. Includes experimental design and outlier column.
- SettingsInfo
Optional: NULL or Named vector where you can include vectors or lists for annotation c(individual_Metab= "ColumnName_SettingsFile_Metab",individual_Sample= "ColumnName_SettingsFile_Sample", color_Metab="ColumnName_SettingsFile_Metab", color_Sample= list("ColumnName_SettingsFile_Sample", "ColumnName_SettingsFile_Sample",...)).Default = NULL
- SettingsFile_Sample
DF which contains information about the samples, which will be combined with your input data based on the unique sample identifiers. and other columns with required PlotSettingInfo.Default = NULL
- SettingsFile_Metab
Optional: DF with column "Metabolite" including the Metabolite names (needs to match Metabolite names of Input_data) and other columns with required PlotSettingInfo. Default = NULL
- PlotName
Optional: String which is added to the output files of the plot
- Scale
Optional: String with the information for Scale row, column or none. Default = row
- SaveAs_Plot
Optional: Select the file type of output plots. Options are svg, pdf, png or NULL. Default = "svg"
- Enforce_FeatureNames
Optional: If there are more than 100 features no rownames will be shown, which is due to readability. You can Enforce this by setting this parameter to TRUE. Default = FALSE
- Enforce_SampleNames
Optional: If there are more than 50 sampless no colnames will be shown, which is due to readability. You can Enforce this by setting this parameter to TRUE. Default = FALSE
- PrintPlot
Optional: print the plots to the active graphic device.
- FolderPath
Optional: String which is added to the resulting folder name default: NULL