Count Entries and Generate a Histogram Plot for a Specified Column
Source:R/RefactorPriorKnoweldge.R
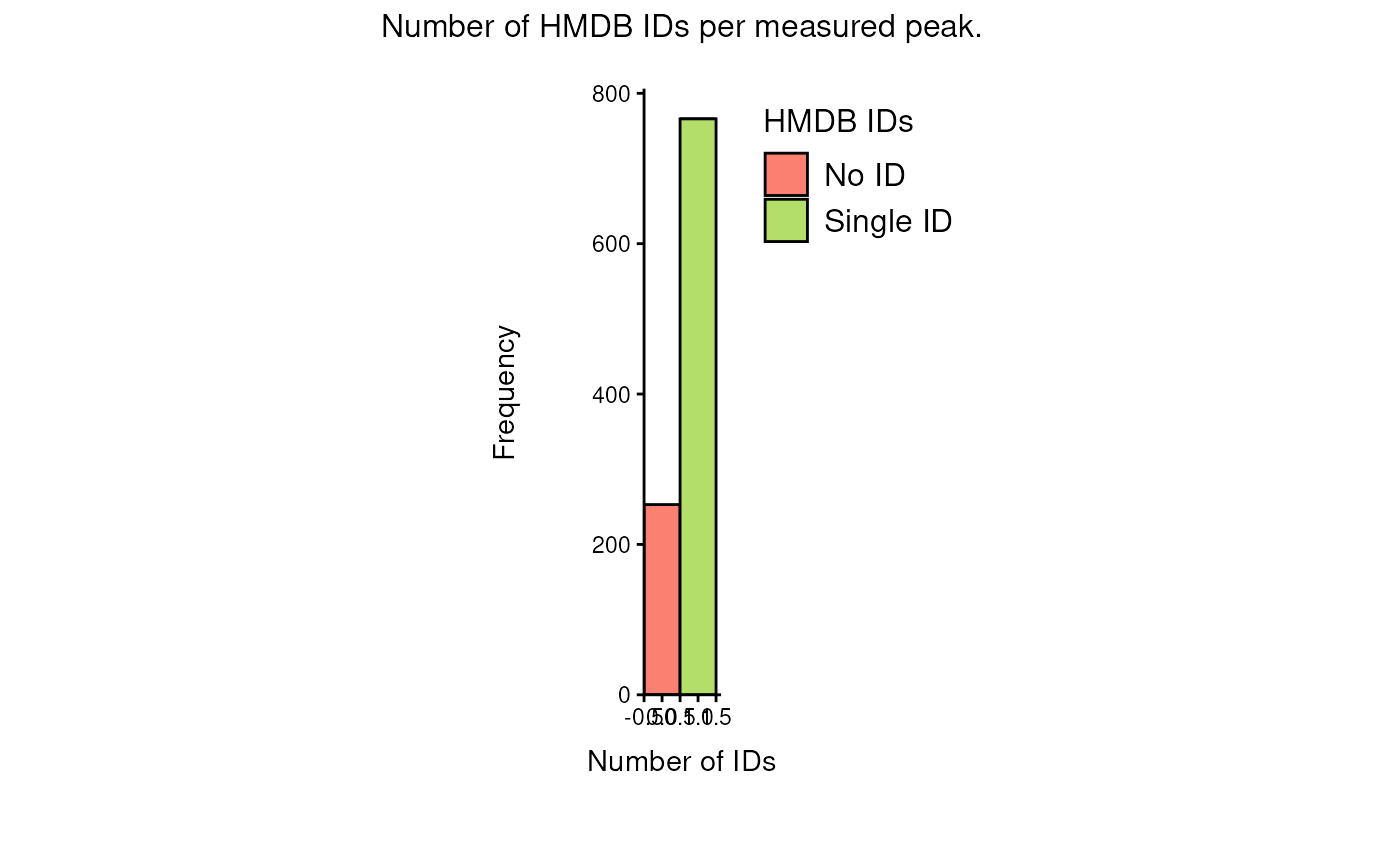
count_id.RdThis function processes a data frame column by counting the number of
entries within each cell. It considers both NA values and empty
strings as zero entries, and categorizes each cell as "No ID", "Single ID",
or "Multiple IDs" based on the count. A histogram is then generated to
visualize the distribution of entry counts. scale_x_continuous
Usage
count_id(
  data,
  column,
  delimiter = ",\n    ",
  fill_colors = c(`No ID` = "#FB8072", `Single ID` = "#B3DE69", `Multiple IDs` =
    "#80B1D3"),
  binwidth = 1,
  title_prefix = NULL,
  save_plot = "svg",
  save_table = "csv",
  print_plot = TRUE,
  path = NULL
)
Arguments
- data
A data frame containing the data to be analyzed.
- column
A string specifying the name of the column in
datato analyze.- delimiter
A string specifying the delimiter used to split cell values. Defaults to
",".- fill_colors
A named character vector providing colors for each category. Defaults to
c("No ID" = "#FB8072", "Single ID" = "#B3DE69", "Multiple IDs" = "#80B1D3").- binwidth
Numeric value specifying the bin width for the histogram. Defaults to
1.- title_prefix
A string to use as the title of the plot. If
NULL(default), the title will be generated as "Number ofIDs per Biocrates Cell". - save_plot
Optional: Select the file type of output plots. Options are svg, png, pdf. Default = svg
- save_table
Optional: File types for the analysis results are: "csv", "xlsx", "txt". Default = "csv"
- print_plot
Optional: TRUE or FALSE, if TRUE Volcano plot is saved as an overview of the results. Default = TRUE
- path
Optional: Path to the folder the results should be saved at. Default = NULL
Value
A list with two elements:
- result
A data frame that includes three additional columns:
was_na(logical indicator of missing or empty cells),entry_count(number of entries in each cell), andid_label(a categorical label based on the entry count).- plot
A
ggplotobject representing the histogram of entry counts.
Examples
data(biocrates_features)
count_id(biocrates_features, "HMDB")