Context-specific models (iMAT)#
iMAT (integrative Metabolic Analysis Tool) technique is a method used for the reconstruction and analysis of genome-scale metabolic models, especially in the context of integrating high-throughput gene expression data.
Genome-scale metabolic reconstructions are systematic representations of the metabolic capabilities of an organism. They are used to make computational predictions about the behavior of metabolic networks under various conditions.
The iMAT method addresses the challenge of determining the activity state of reactions in the metabolic network given gene expression data. Traditional methods often rely on the assumption that the expression level of a gene correlates with the activity of the corresponding enzyme, which may not always be accurate.
Gene expression data is first discretized, classifying genes into ‘High’, ‘Medium’, or ‘Low’ expression categories based on specific criteria, often grounded on dataset-specific quantiles. Following this classification, the association of genes to metabolic reactions is accomplished using gene-protein-reaction (GPR) associations. In essence, every metabolic reaction, based on the enzymes that catalyze it, is linked to one or more genes. Using GPR associations, each reaction receives a propensity score reflecting its likelihood to be active, based on the expression state of its associated genes.
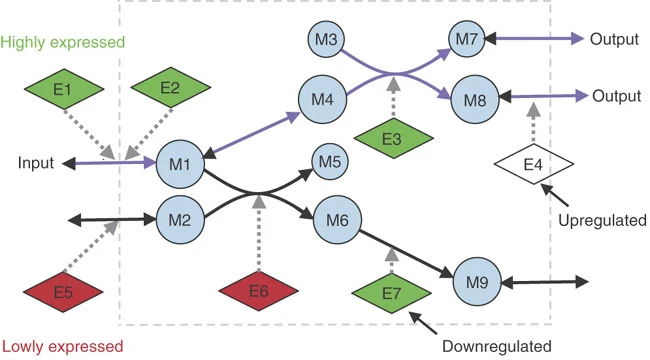
Figure 1: Shlomi, Tomer, et al. "Network-based prediction of human tissue-specific metabolism." Nature biotechnology 26.9 (2008): 1003-1010 .
Figure 1 shows an example of the iMAT method from the original publication. Metabolites are symbolized by circular nodes, while enzymes are denoted by diamond-shaped nodes. Enzyme-encoding genes are color-coded: white indicates normal expression, red corresponds to low expression, and green indicates high expression. Continuous lines show metabolic reactions, while dotted lines link enzymes to the reactions they facilitate. Purple arrows represent the predicted steady-state metabolic flux using the enzymes associated to highly expressed enzyme-encoding genes. In this example it’s predicted that Enzyme E4 will undergo post-transcriptional upregulation, since the enzyme-encoding gene has normal expression but the enzyme is required to mainatin steady-state flux (consistent with the other measurements), while Enzyme E7 is expected to experience post-transcriptional downregulation (since it’s highly expressed but flux is predicted to go through a different pathway)
Rather than linearly mapping gene expression to metabolic flux activity, iMAT finds a steady-state flux distribution that aligns with the activity of highly expressed genes, minimizing the metabolic flux through reactions whose enzymes depend on lowly expressed genes. This is crucial because, in many biological systems, gene expression doesn’t directly translate to enzymatic activity. The resulting optimized flux distribution is also in harmony with the metabolic model’s stoichiometric and thermodynamic constraints.
import numpy as np

import corneto as cn

cn.info()

|
|
Gem = cn.Graph()
Gem.add_edge(
    {"M1", "M2"}, {"M5", "M6"}, genes=["E6"], weight=-1, default_lb=0, default_ub=100
)
Gem.add_edge("M1", "M4", genes=[], default_lb=-100, default_ub=100)
Gem.add_edge(
    {"M3", "M4"}, {"M7", "M8"}, genes=["E3"], weight=1, default_lb=0, default_ub=100
)
Gem.add_edge("M6", "M9", genes=["E7"], weight=1, default_lb=0, default_ub=100)
Gem.add_edge((), "M1", genes=["E1", "E2"], weight=1, default_lb=-100, default_ub=100)
Gem.add_edge((), "M2", genes=["E5"], weight=-1, default_lb=-100, default_ub=100)
Gem.add_edge((), "M3", genes=[], default_lb=-100, default_ub=100)
Gem.add_edge("M5", (), genes=[], default_lb=-100, default_ub=100)
Gem.add_edge("M7", (), genes=[], default_lb=-100, default_ub=100)
Gem.add_edge("M8", (), genes=[], default_lb=-100, default_ub=100)
Gem.add_edge("M9", (), genes=[], default_lb=-100, default_ub=100)
Gem.plot(graph_attr={"rankdir": "LR", "center": "1"})

weights = np.array(
    [Gem.get_attr_edge(i).get("weight", 0) for i in range(Gem.num_edges)]
)
weights
array([-1, 0, 1, 1, 1, -1, 0, 0, 0, 0, 0])
from corneto.methods.metabolism.fba import multicondition_imat as imat

P = imat(Gem, weights, scale=False)
P.solve(solver="SCIPY")
Problem(Minimize(Expression(AFFINE, UNKNOWN, ())), [Inequality(Constant(CONSTANT, NONPOSITIVE, (11,))), Inequality(Variable((11,), _flow)), Equality(Expression(AFFINE, UNKNOWN, (9,)), Constant(CONSTANT, ZERO, ())), Inequality(Expression(AFFINE, NONNEGATIVE, (11,))), Equality(Expression(AFFINE, NONNEGATIVE, (3,)), Constant(CONSTANT, ZERO, ())), Inequality(Expression(AFFINE, UNKNOWN, (11,))), Inequality(Variable((11,), _flow)), Inequality(Expression(AFFINE, NONNEGATIVE, (11,))), Inequality(Variable((11,), _or, boolean=True))])
Gem.edge_subgraph(P.expr.flow.value > 1e-6).plot()

We can make the plot to look more like the image from the original paper by drawing the reactions with fluxes above a certain threshold with a wider line:
Gem.plot(
    custom_edge_attr=cn.pl.flow_style(P), graph_attr={"rankdir": "LR", "center": "1"}
)
