CytoCopteR is a full Java implementation which provides an intuitive and easy to learn graphical user interface (GUI) to CellNOptR.
This results in a point and click interface where users can run the same steps as they would using an R script without having to actually write any code. Consistency is ensured between the results obtained through the GUI and those obtained through the corresponding scripts.
Cytocopter can be installed as a plug-in to Cytoscape - version 3.5. needed
CytoCopteR can be downloaded from the cytoscape App store (Download link here) and then installed manually by copying the jar to CytoscapeConfiguration folder. This folder is usually kept in the user home folder.
Better yet, Cytoscape can also be directly installed from cytoscape by following these simple steps:
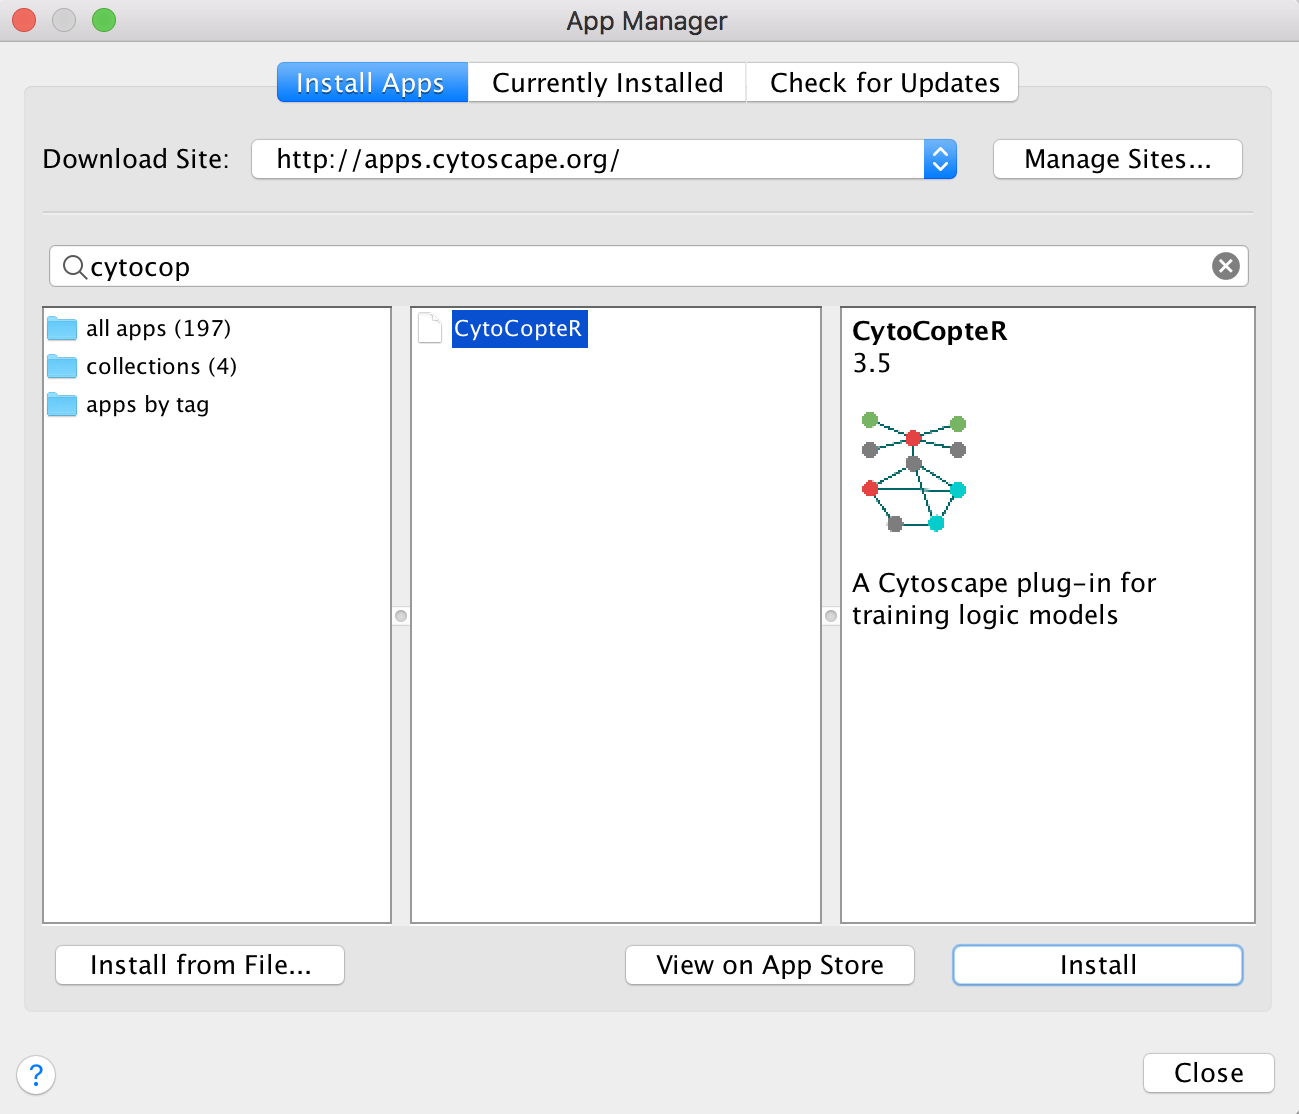
Go to Apps and then App Manager… and finally search for CytoCopteR in the search bar and press Install.
The necessary files for this tutorial is a network sif file and the corresponding experimental data in MIDAS format.
To illustrate the use of Cytocopter, we will use a biologically plausible prior knowledge network (PKN). This network includes a subset of intracellular signalling networks known to be activated downstream of EGF and TNFa stimulation (MacNamara et al.).
The accompanying in silico data (MIDAS file format) replicates biologically plausible behaviour that has been observed in such networks, such as transient behaviour of ERK activation and the oscillatory dynamics of NGkB translocation from the cytoplasm to the nucleus.
For more details about MIDAS format, please see here
After CytoCopteR is installed, we can now import the data files through the import function in Cytoscape. We first import the network ToyModelPB.sif through the import function in Cytoscape. If the network is stored in a SBMLqual file, the user can simply press the “Import from SBML” to choose the path to the appropriate xml file from the import.
At this point we already have the network imported, now we can use our experimental data and see how it maps into the network. In other words visualise which nodes are measured, inhibited and stimulated. For more details, please consult Terfve et al..
Select CytoCopter panel on the left side panel
On the network dropdown box, we have our imported network. We can as well load a model in an SBML format by cliccking on Impost from SBML interface and selexting the .xml. file.
Click on the data text fiels and a window will pop-up to browse the previosly downloaded experimental (MIDAS file)
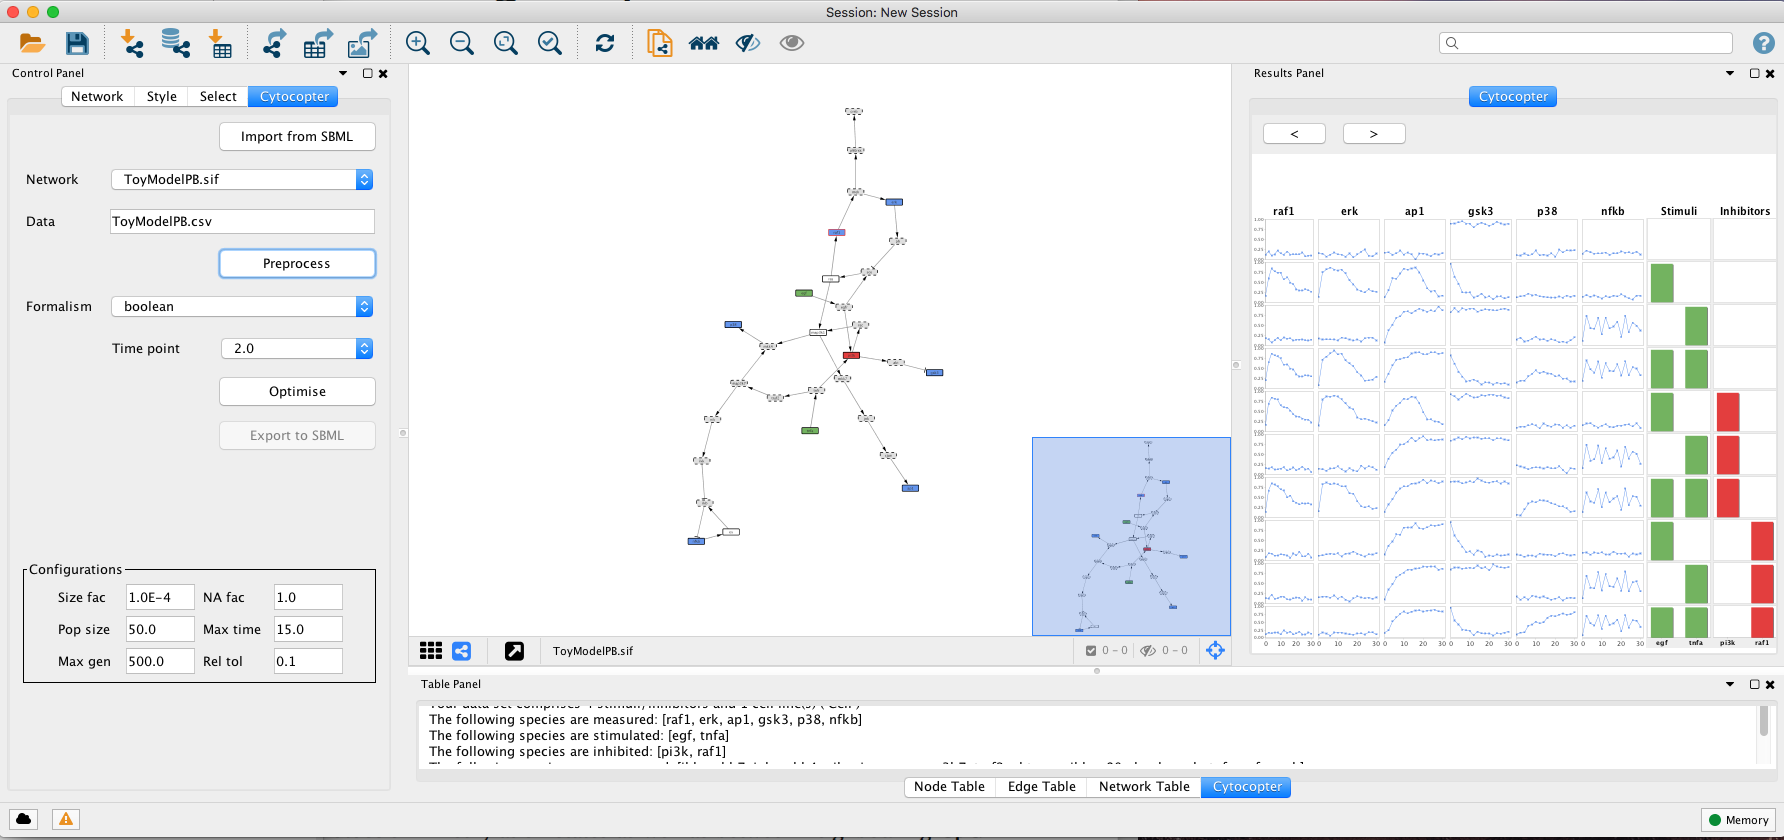
After the data is selected, press the Preprocess button. This procedure may take a few minutes.
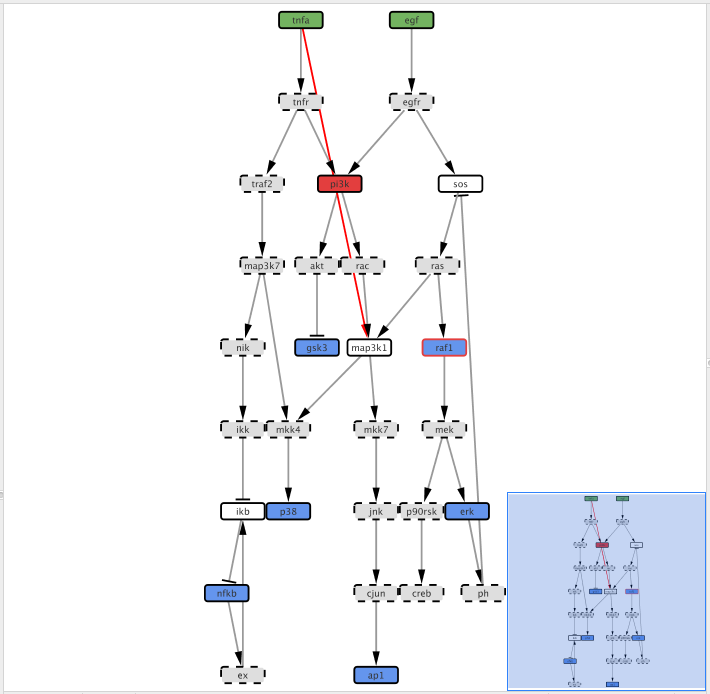
The Preprocess function will annotate automatically the network: Green nodes are stimulated species; Red nodes are inhibited species; Blue nodes are measured species; Grey nodes with dashed borders can be removed to simplify the network; Blue nodes with red borders are measured and inhibited nodes; White nodes are not measured or perturbed that cannot be simplified.
In this step, we will use the optimise features of CellNOptR R package to optimise the topology of the network against previously loaded experimental data. For more details, please consult Terfve et al..
Select a formalism to model the network. Select the Boolean Formalism. Boolean formalism will consider that the states of each node will be either active or inactive. Because the Boolean formalism requires only two time points and the given data-set has 16, the first time point is automatically set to 0 and the second one is selected by the user
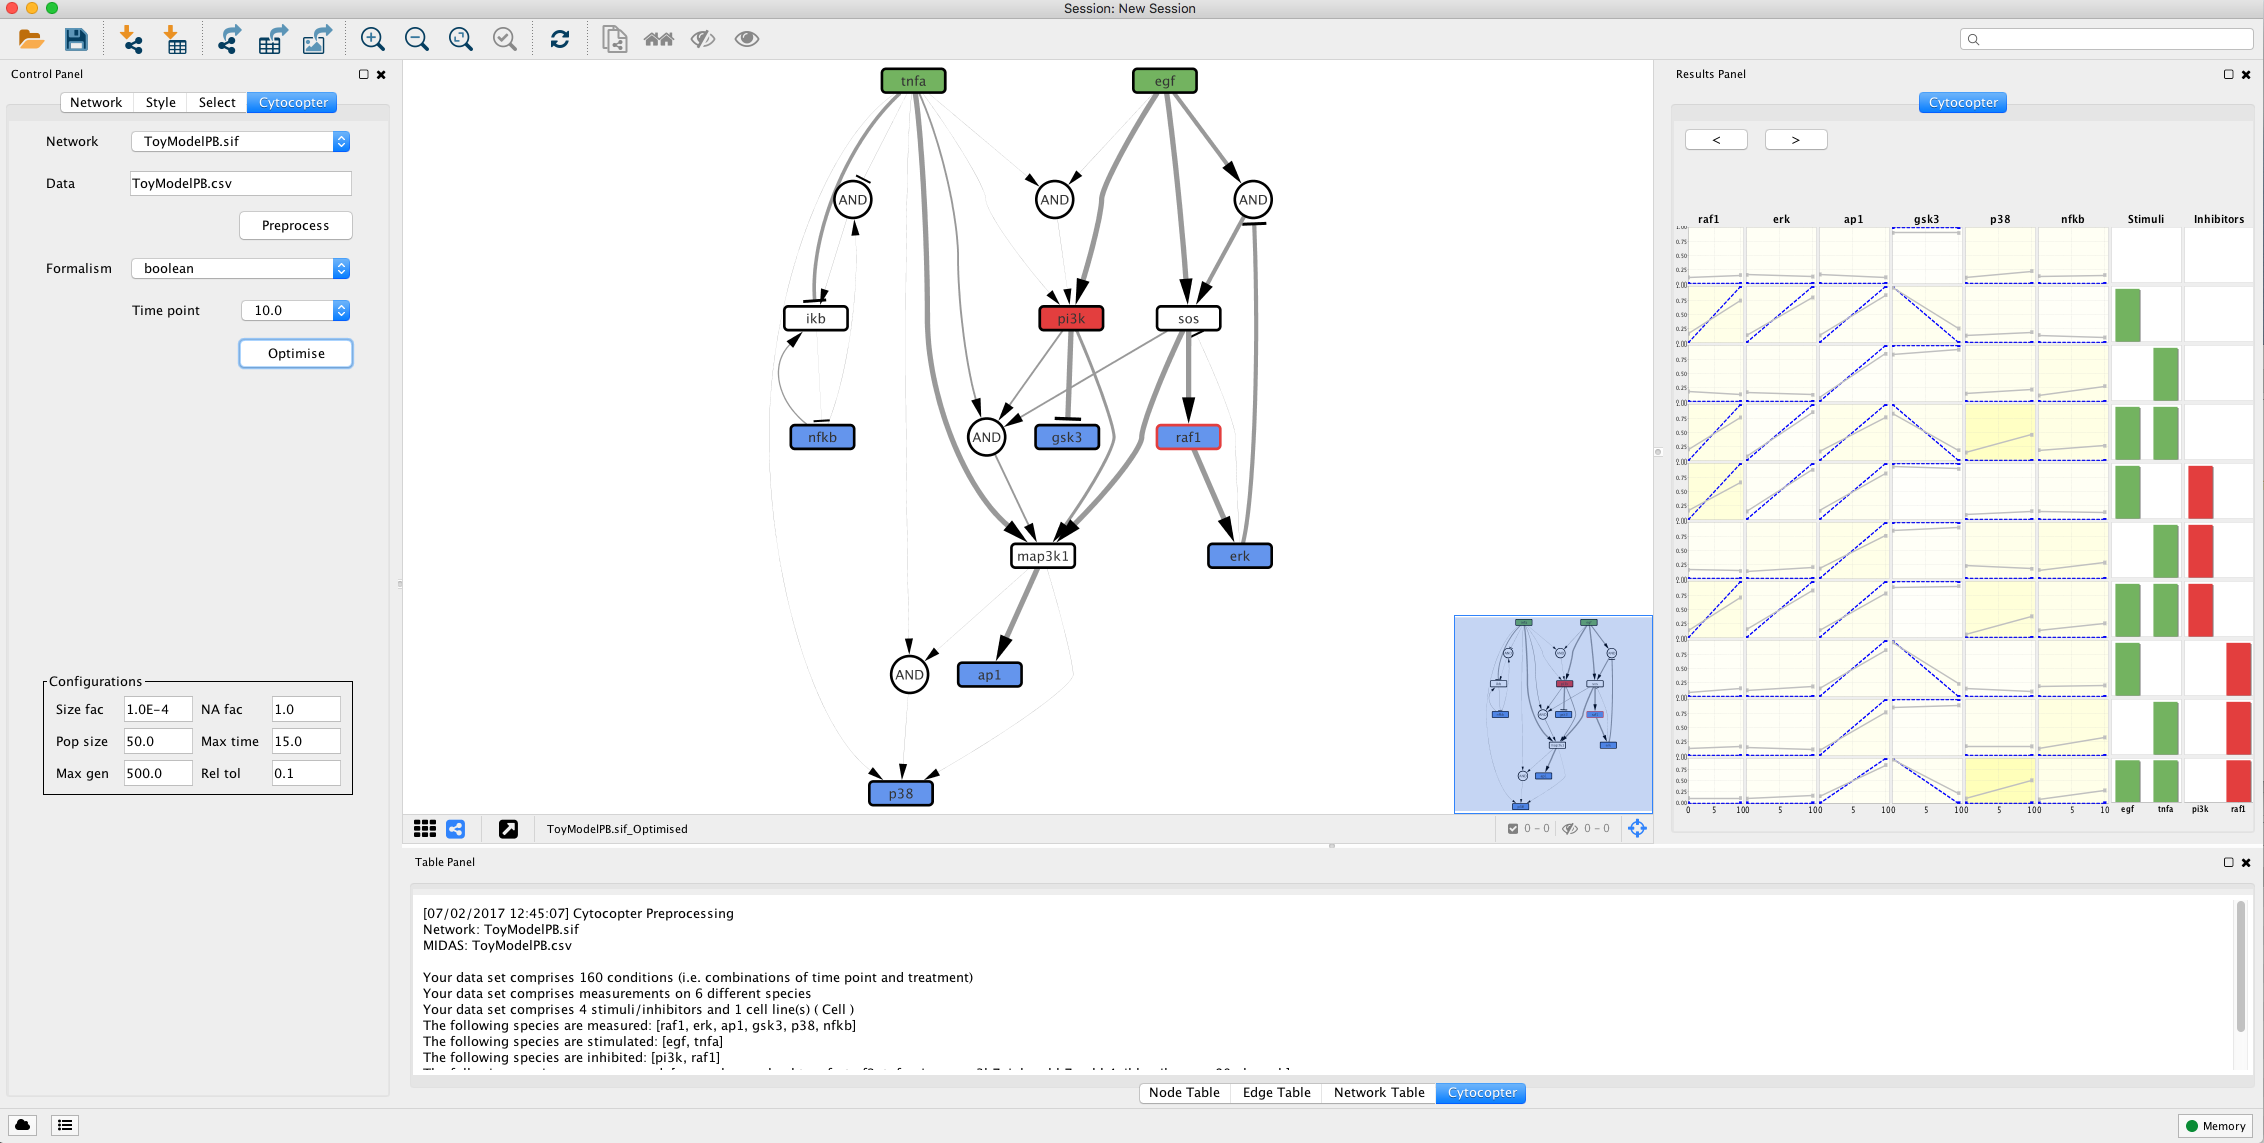
Select time point 10 from the Time point dropdown box
After selecting the time point, press the optimise button. Note this will take several minutes. This optimisation is done using a specific genetic algorithm and its parameters can be configured in the Configuration panels, such as maxmum time allowed for the algorithm to run in the Max time parameter.
The optimisation procedure outputs an optimised network and a plot displaying how well the simlated models fit with the given experimental data. The colour gradient quantifies the error levels. Additionally, the user can import the optimised network to SBMLqual file using the Export to SBML button.
This type of analysis is very helpful to identify possible missing links. For instance, if we focus on the fit plot generated by the optimisation function we can see that ap1 has an increased error when compared to the other measured species. Lets see if we can improve this.
Minimise the optimised network and select the network used to run the optimisation.
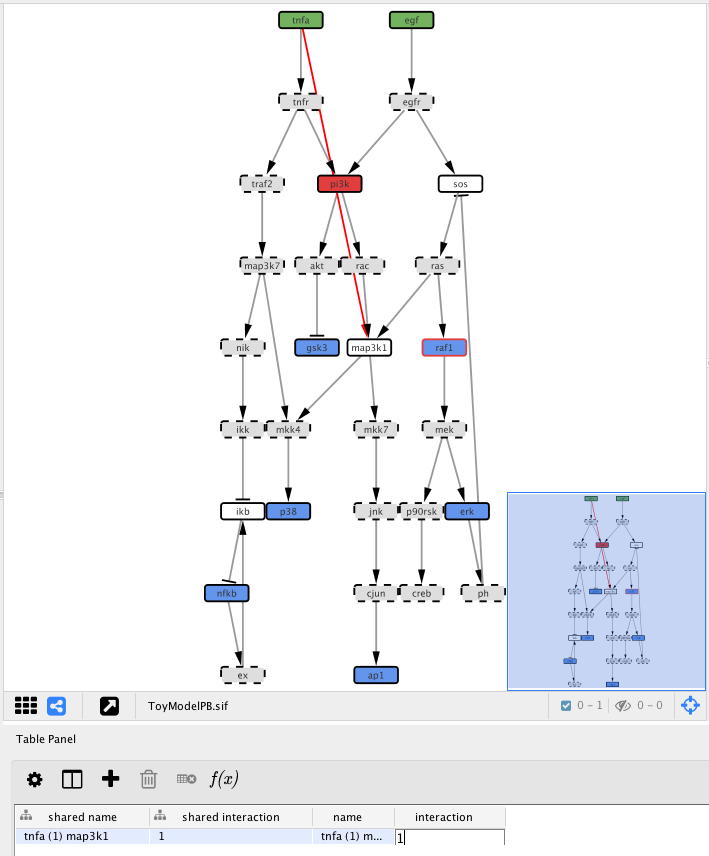
Right-click on the tnfa and then click Add and the Edge. Drag the edge and connect tnfa to map3k1 node
After adding the edge, we need to define the type of interaction, i.e. if tnfa activates (1) map3k1 or inhibits (-1) its activity. Click on the Edge Table panel in Cytoscape bottom panel then select the previously added edge.
Now double-click in the table cell with the value “interaction” text with 1
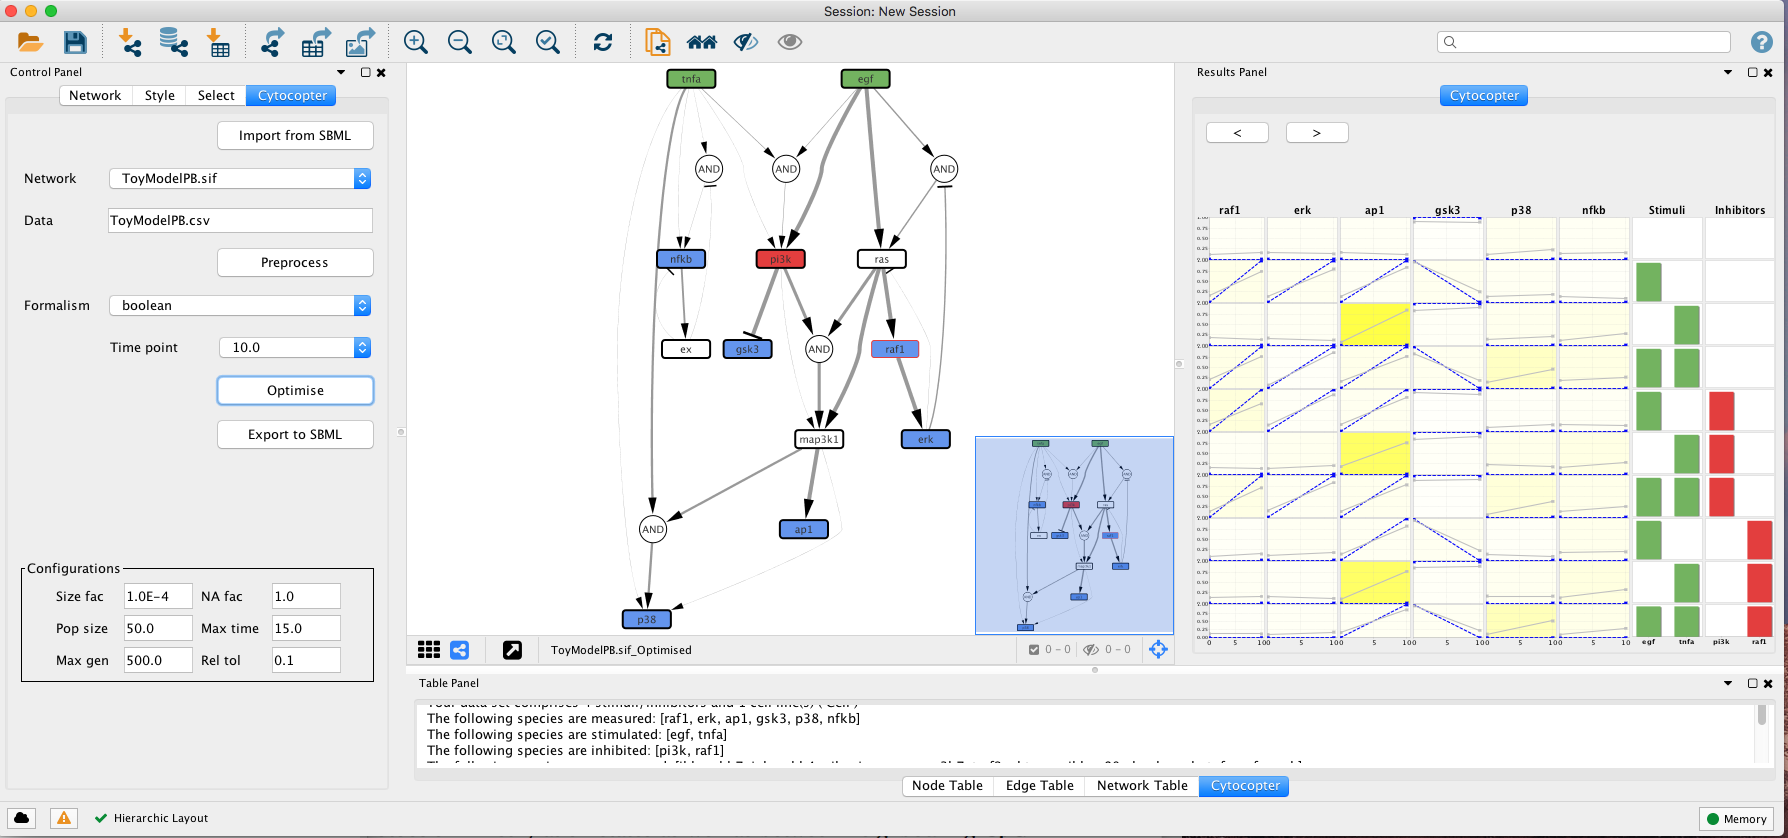
Now click the Optimise button to re-run exactly the previous optimisation with the exception of the extra edge that we just added.
After the optimisation, we can see that the ap1 simulated values fit much better the existing data which can possibly indicate that the link that we added before is missing from the network taht we imported.