A plotting wrapper for drawing gene/abundance maps on tissue
draw_maps.RdA plotting wrapper for drawing gene/abundance maps on tissue
Usage
draw_maps(
  spatial,
  weights,
  normalize = TRUE,
  ncol = 4,
  trans = "identity",
  size = 0.5,
  shape = 19,
  flip_y = TRUE,
  viridis_option = "magma",
  legend_title = "abundance",
  background = "gray90"
)
Arguments
- spatial
Coordinates
- weights
Weights to draw (spot x feature)
- normalize
Whether weights should sum up to 1 for each spot
- ncol
Number of columns in the grid
- trans
Color transformation scale
- size
Size of points
- shape
Shape of points
- flip_y
Whether y axis should be negated
- viridis_option
Viridis color options
- legend_title
Title of color legend
- background
Background color of plot
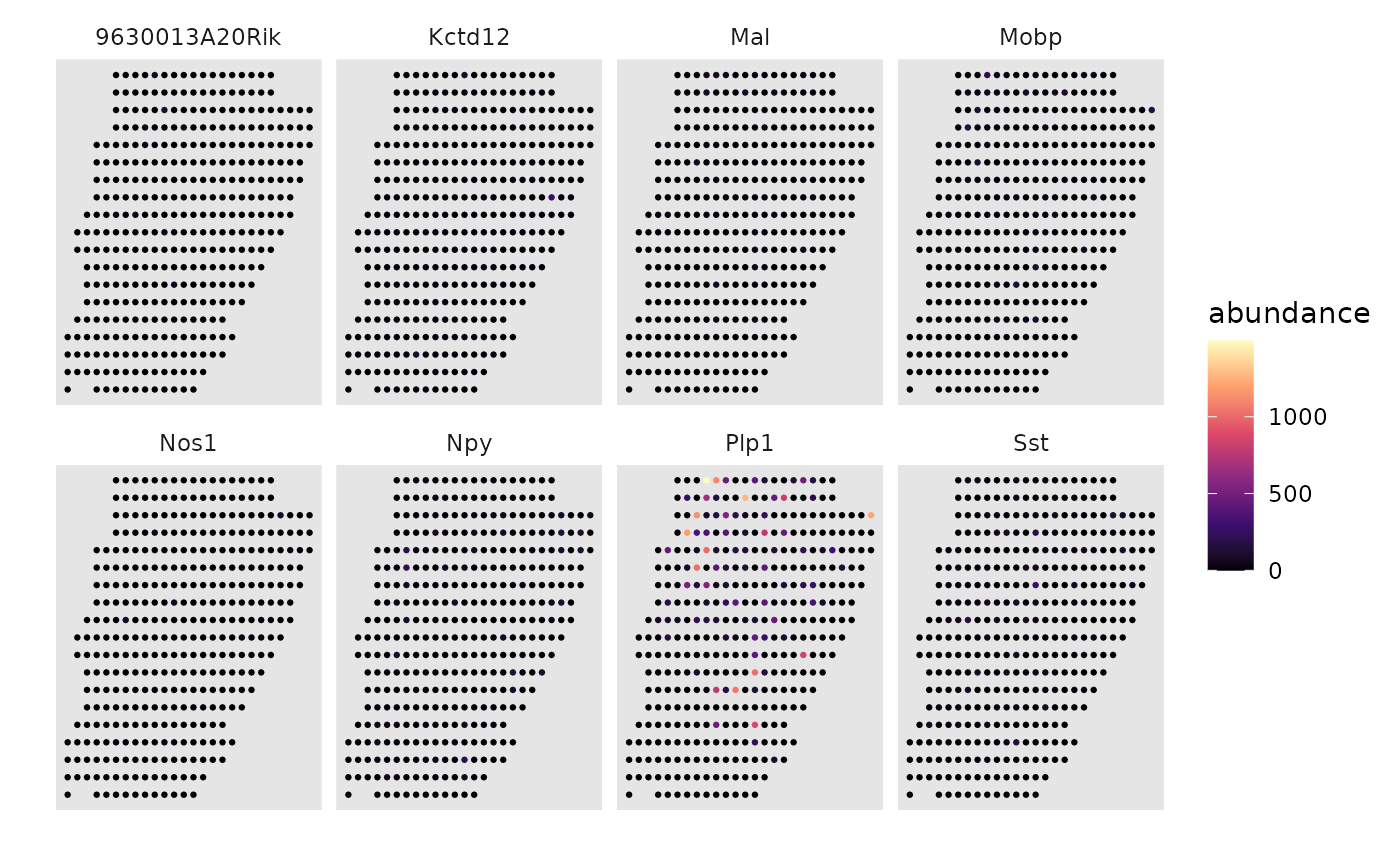
Examples
data(dot.sample)
draw_maps(dot.sample$srt$coordinates, t(as.matrix(dot.sample$srt$counts[1:8, ])), normalize = FALSE)
#> Warning: `aes_string()` was deprecated in ggplot2 3.0.0.
#> ℹ Please use tidy evaluation idioms with `aes()`.
#> ℹ See also `vignette("ggplot2-in-packages")` for more information.
#> ℹ The deprecated feature was likely used in the DOTr package.
#>   Please report the issue to the authors.