This script performs metabolite clustering analysis and computes clusters of metabolites based on regulatory rules between Intracellular and culture media metabolomics (CoRe experiment).
Source:R/MetaboliteClusteringAnalysis.R
MCA_CoRe.RdThis script performs metabolite clustering analysis and computes clusters of metabolites based on regulatory rules between Intracellular and culture media metabolomics (CoRe experiment).
Usage
MCA_CoRe(
  InputData_Intra,
  InputData_CoRe,
  SettingsInfo_Intra = c(ValueCol = "Log2FC", StatCol = "p.adj", StatCutoff = 0.05,
    ValueCutoff = 1),
  SettingsInfo_CoRe = c(DirectionCol = "CoRe", ValueCol = "Log2(Distance)", StatCol =
    "p.adj", StatCutoff = 0.05, ValueCutoff = 1),
  FeatureID = "Metabolite",
  SaveAs_Table = "csv",
  BackgroundMethod = "Intra&CoRe",
  FolderPath = NULL
)
Arguments
- InputData_Intra
DF for your data (results from e.g. DMA) containing metabolites in rows with corresponding Log2FC and stat (p-value, p.adjusted) value columns.
- InputData_CoRe
DF for your data (results from e.g. DMA) containing metabolites in rows with corresponding Log2FC and stat (p-value, p.adjusted) value columns. Here we additionally require
- SettingsInfo_Intra
Optional: Pass ColumnNames and Cutoffs for the intracellular metabolomics including the value column (e.g. Log2FC, Log2Diff, t.val, etc) and the stats column (e.g. p.adj, p.val). This must include: c(ValueCol=ColumnName_InputData_Intra,StatCol=ColumnName_InputData_Intra, StatCutoff= NumericValue, ValueCutoff=NumericValue) Default=c(ValueCol="Log2FC",StatCol="p.adj", StatCutoff= 0.05, ValueCutoff=1)
- SettingsInfo_CoRe
Optional: Pass ColumnNames and Cutoffs for the consumption-release metabolomics including the direction column, the value column (e.g. Log2Diff, t.val, etc) and the stats column (e.g. p.adj, p.val). This must include: c(DirectionCol= ColumnName_InputData_CoRe,ValueCol=ColumnName_InputData_CoRe,StatCol=ColumnName_InputData_CoRe, StatCutoff= NumericValue, ValueCutoff=NumericValue)Default=c(DirectionCol="CoRe", ValueCol="Log2(Distance)",StatCol="p.adj", StatCutoff= 0.05, ValueCutoff=1)
- FeatureID
Optional: Column name of Column including the Metabolite identifiers. This MUST BE THE SAME in each of your Input files. Default="Metabolite"
- SaveAs_Table
Optional: File types for the analysis results are: "csv", "xlsx", "txt" default: "csv"
- BackgroundMethod
Optional: Background method `Intra|CoRe, Intra&CoRe, CoRe, Intra or * Default="Intra&CoRe"
- FolderPath
Optional: Path to the folder the results should be saved at. default: NULL
Value
List of two DFs: 1. Summary of the cluster count and 2. the detailed information of each metabolites in the clusters.
Examples
Media <- MetaProViz::ToyData("CultureMedia_Raw")
ResM <- MetaProViz::PreProcessing(InputData = Media[-c(40:45) ,-c(1:3)],
SettingsFile_Sample = Media[-c(40:45) ,c(1:3)] ,
SettingsInfo = c(Conditions = "Conditions", Biological_Replicates = "Biological_Replicates", CoRe_norm_factor = "GrowthFactor", CoRe_media = "blank"),
CoRe=TRUE)
#> For Consumption Release experiment we are using the method from Jain M. REF: Jain et. al, (2012), Science 336(6084):1040-4, doi: 10.1126/science.1218595.
#> FeatureFiltering: Here we apply the modified 80%-filtering rule that takes the class information (Column `Conditions`) into account, which additionally reduces the effect of missing values (REF: Yang et. al., (2015), doi: 10.3389/fmolb.2015.00004). Filtering value selected: 0.8
#> 3 metabolites where removed: N-acetylaspartylglutamate, hypotaurine, S-(2-succinyl)cysteine
#> Missing Value Imputation: Missing value imputation is performed, as a complementary approach to address the missing value problem, where the missing values are imputing using the `half minimum value`. REF: Wei et. al., (2018), Reports, 8, 663, doi:https://doi.org/10.1038/s41598-017-19120-0
#> NA values were found in Control_media samples for metabolites. For metabolites including NAs MVI is performed unless all samples of a metabolite are NA.
#> Metabolites with high NA load (>20%) in Control_media samples are: dihydroorotate.
#> Metabolites with only NAs (=100%) in Control_media samples are: hydroxyphenylpyruvate. Those NAs are set zero as we consider them true zeros
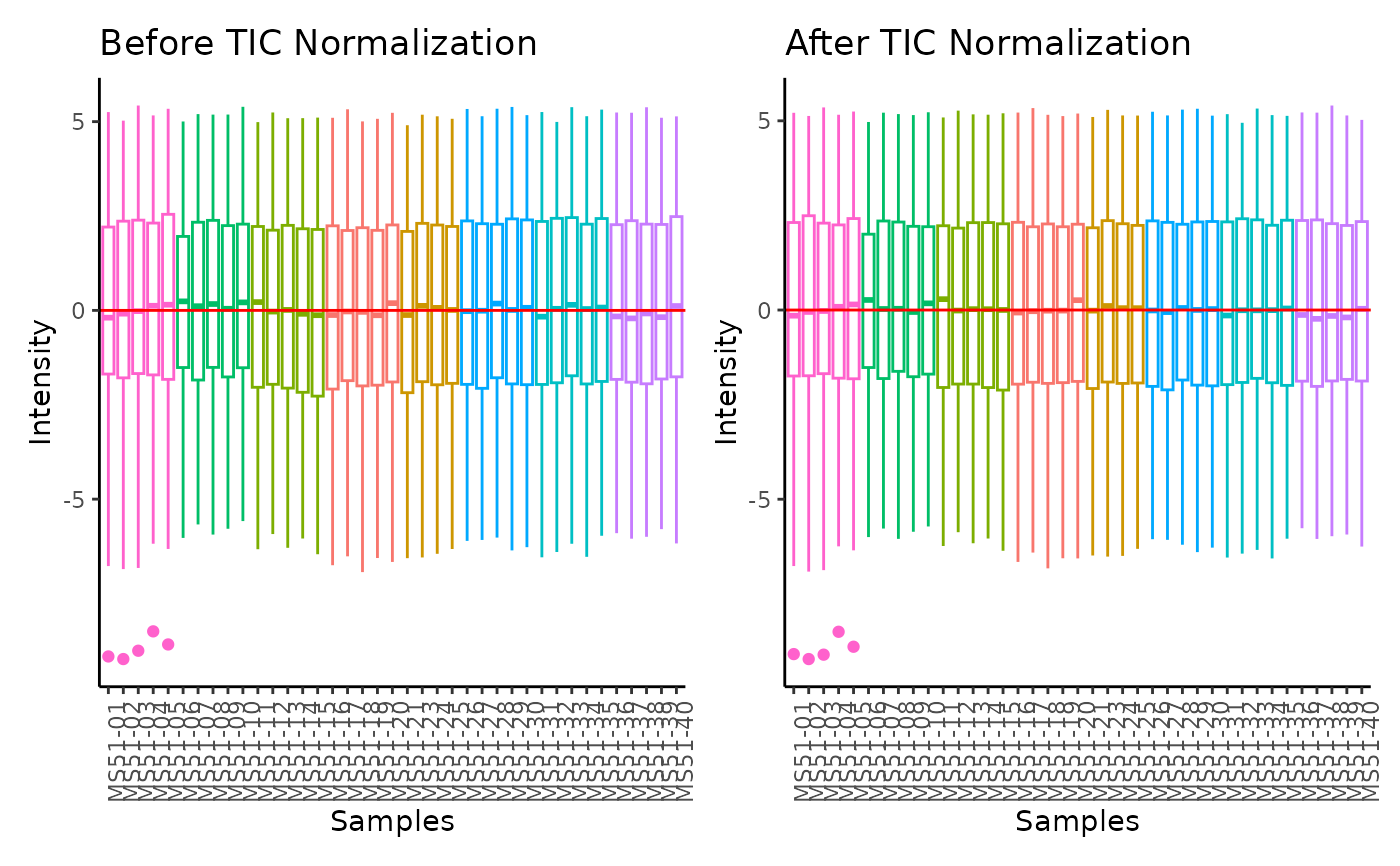
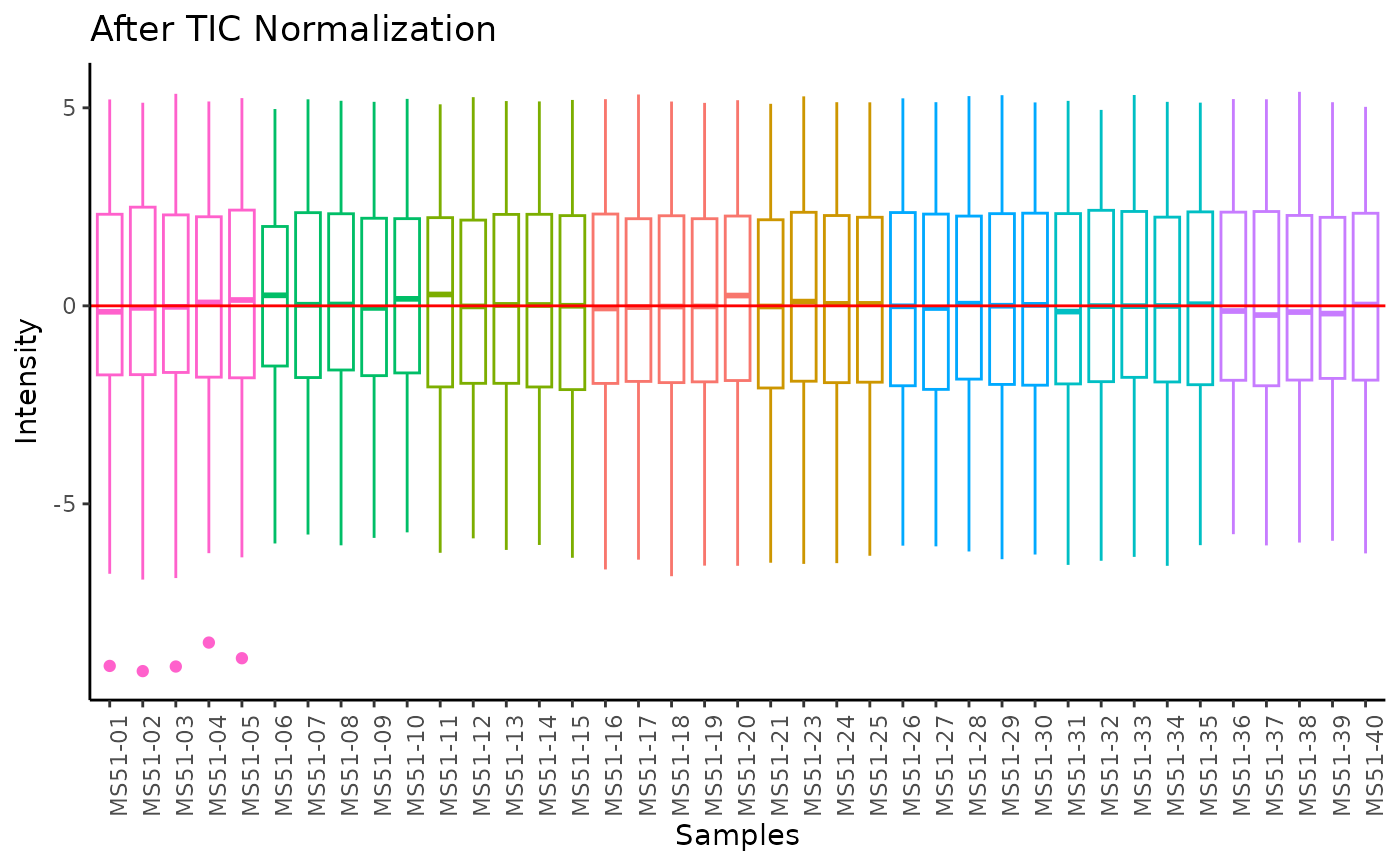
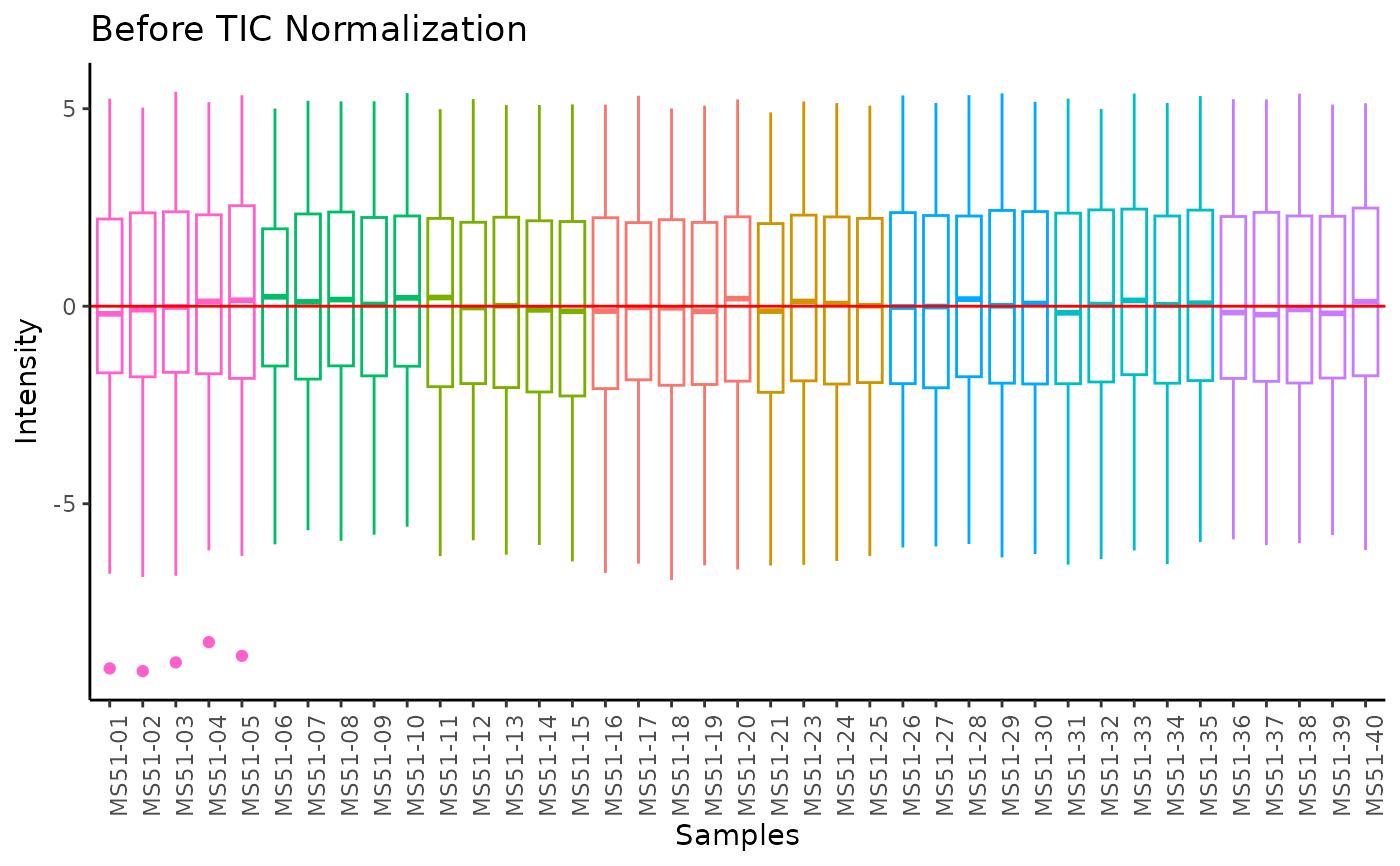
#> Total Ion Count (TIC) normalization: Total Ion Count (TIC) normalization is used to reduce the variation from non-biological sources, while maintaining the biological variation. REF: Wulff et. al., (2018), Advances in Bioscience and Biotechnology, 9, 339-351, doi:https://doi.org/10.4236/abb.2018.98022
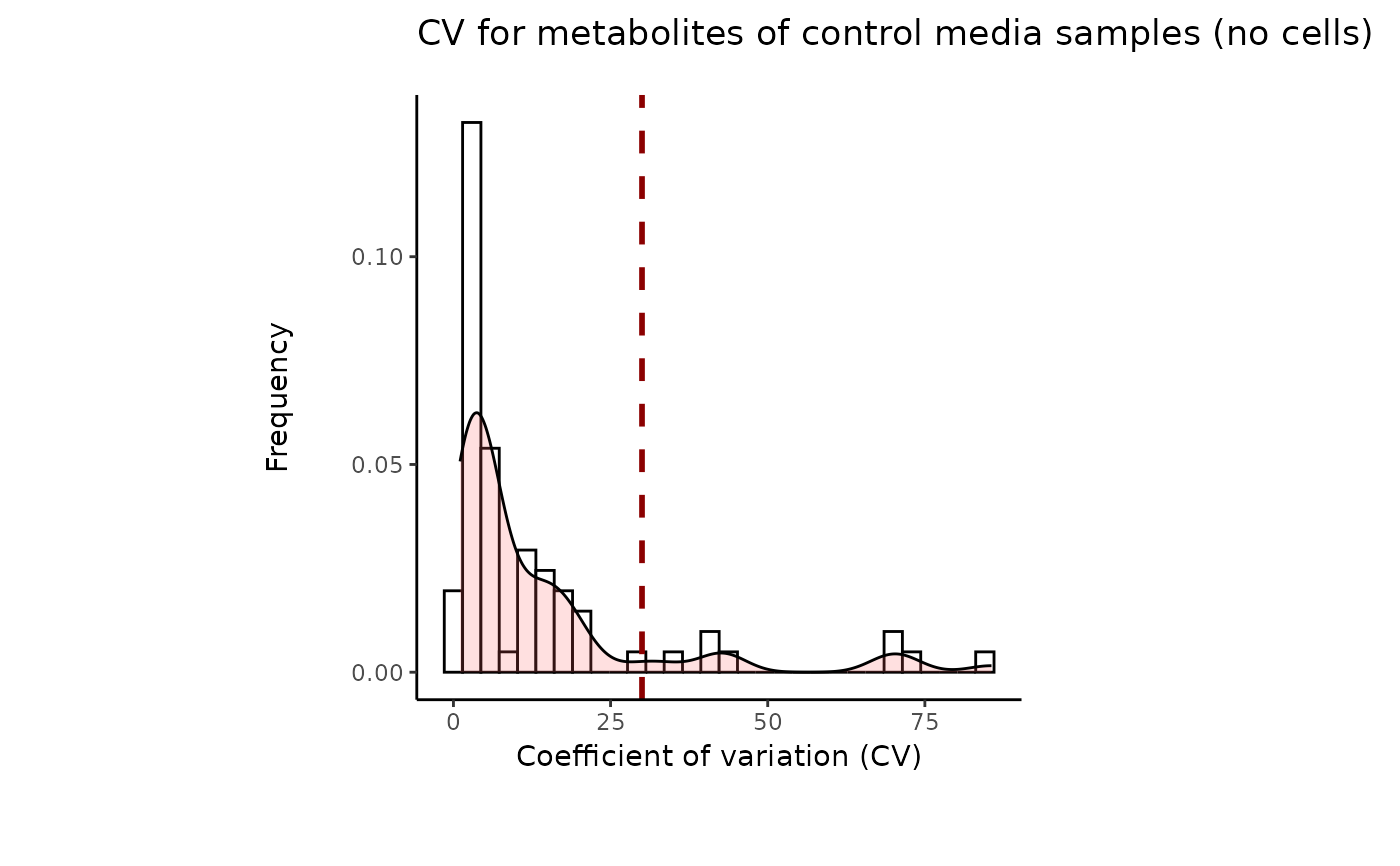
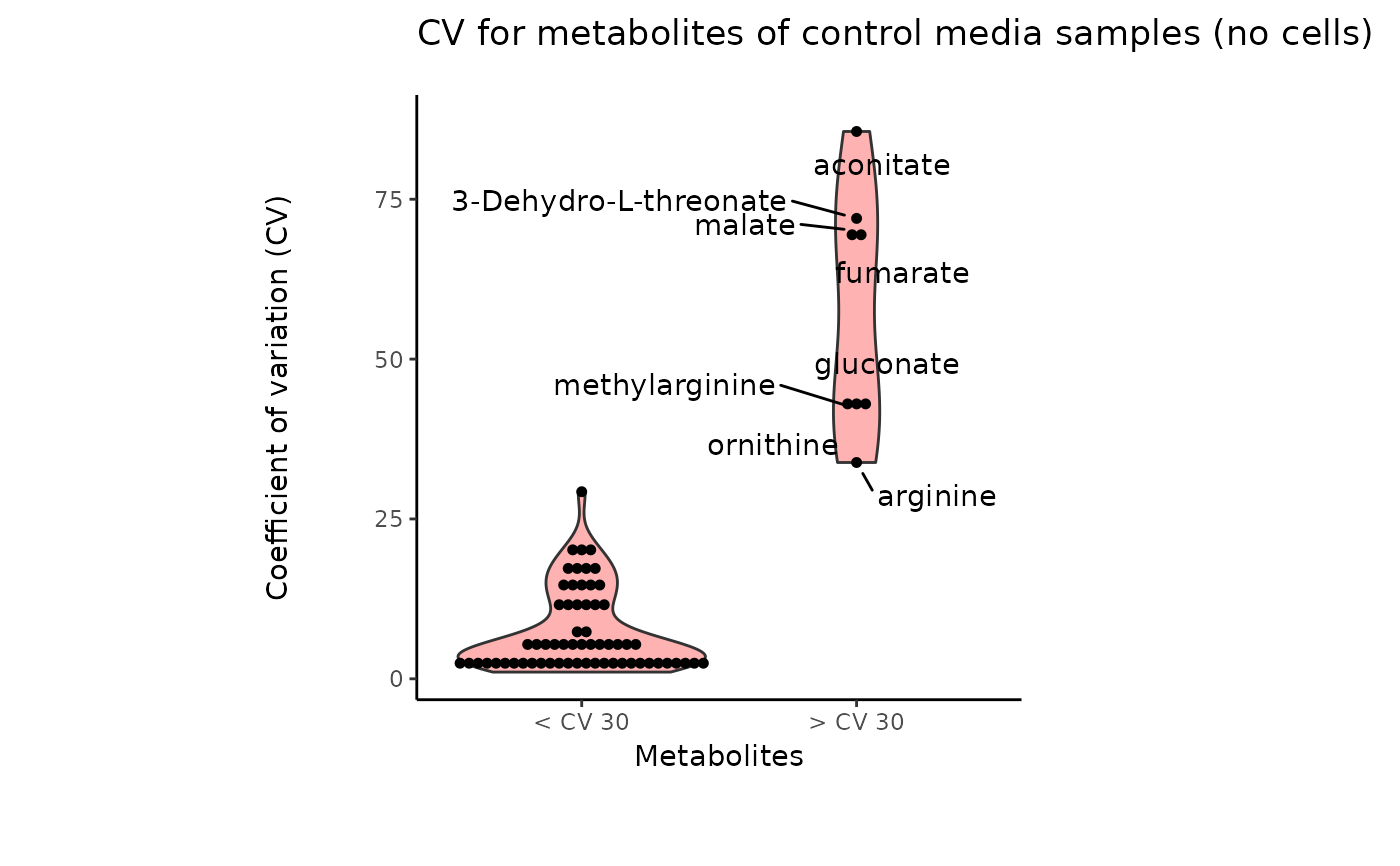
#> 8 of variables have high variability (CV > 30) in the CoRe_media control samples. Consider checking the pooled samples to decide whether to remove these metabolites or not.
#> Warning: The CoRe_media samples MS51-06 were found to be different from the rest. They will not be included in the sum of the CoRe_media samples.
#> CoRe data are normalised by substracting mean (blank) from each sample and multiplying with the CoRe_norm_factor
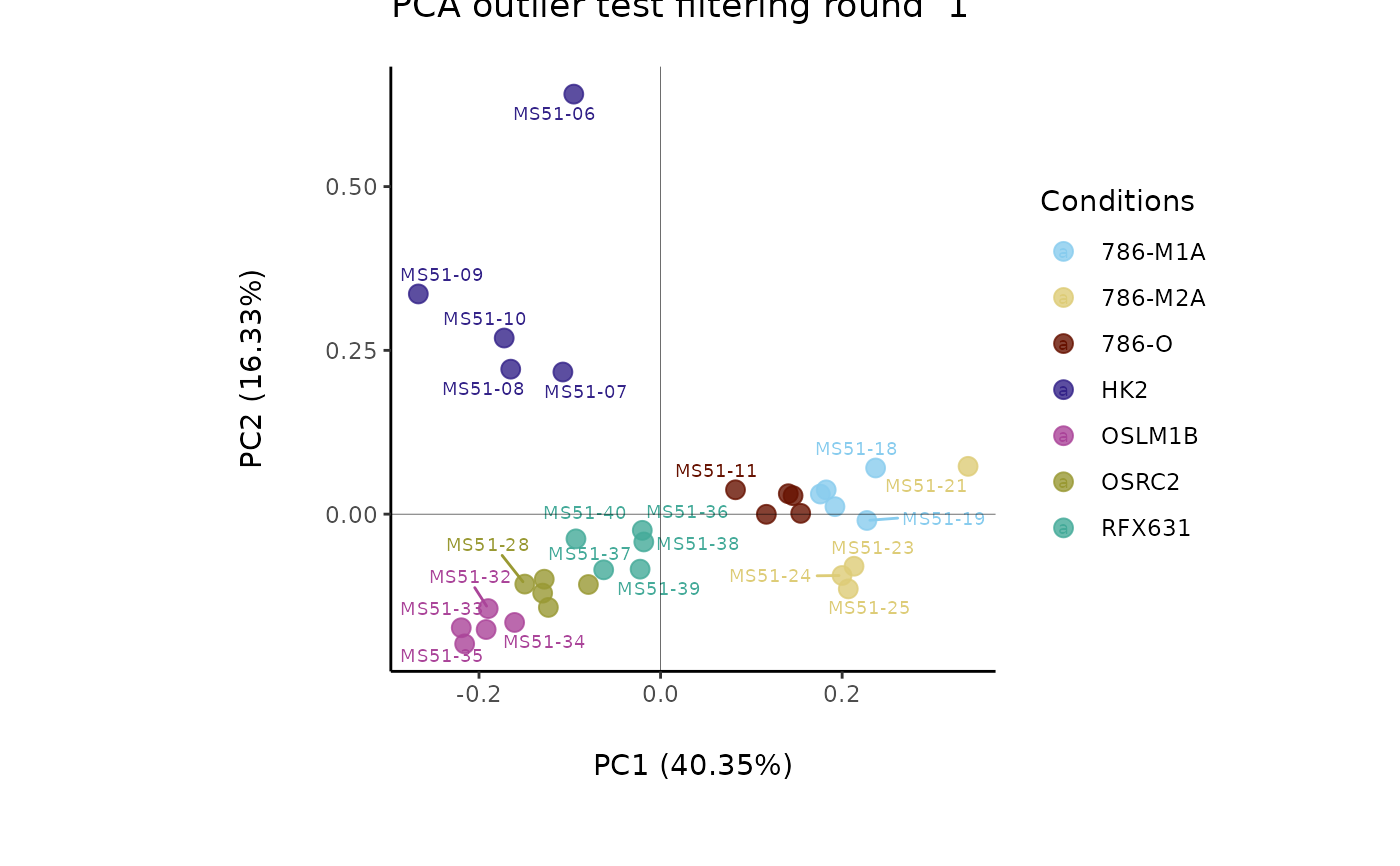
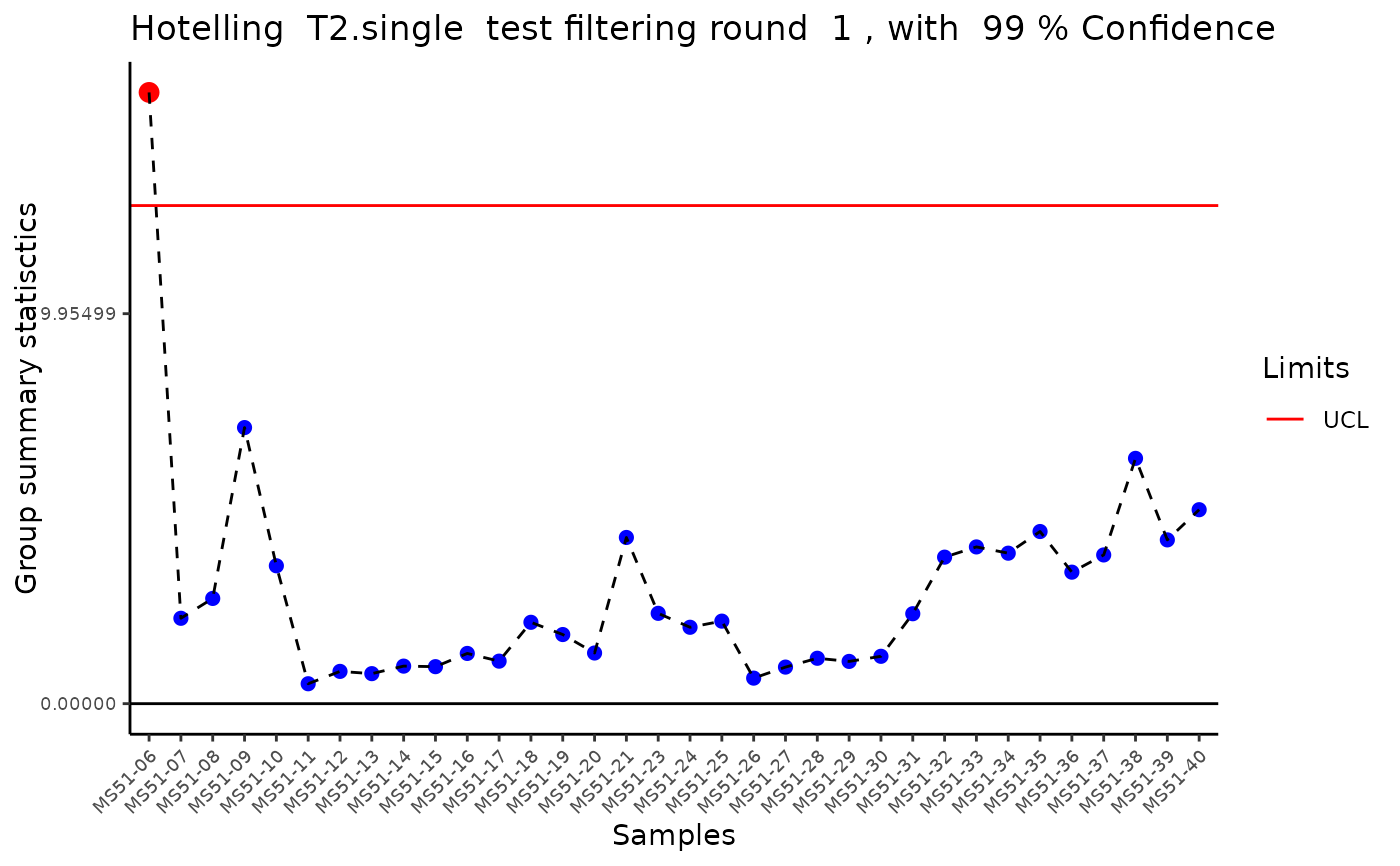
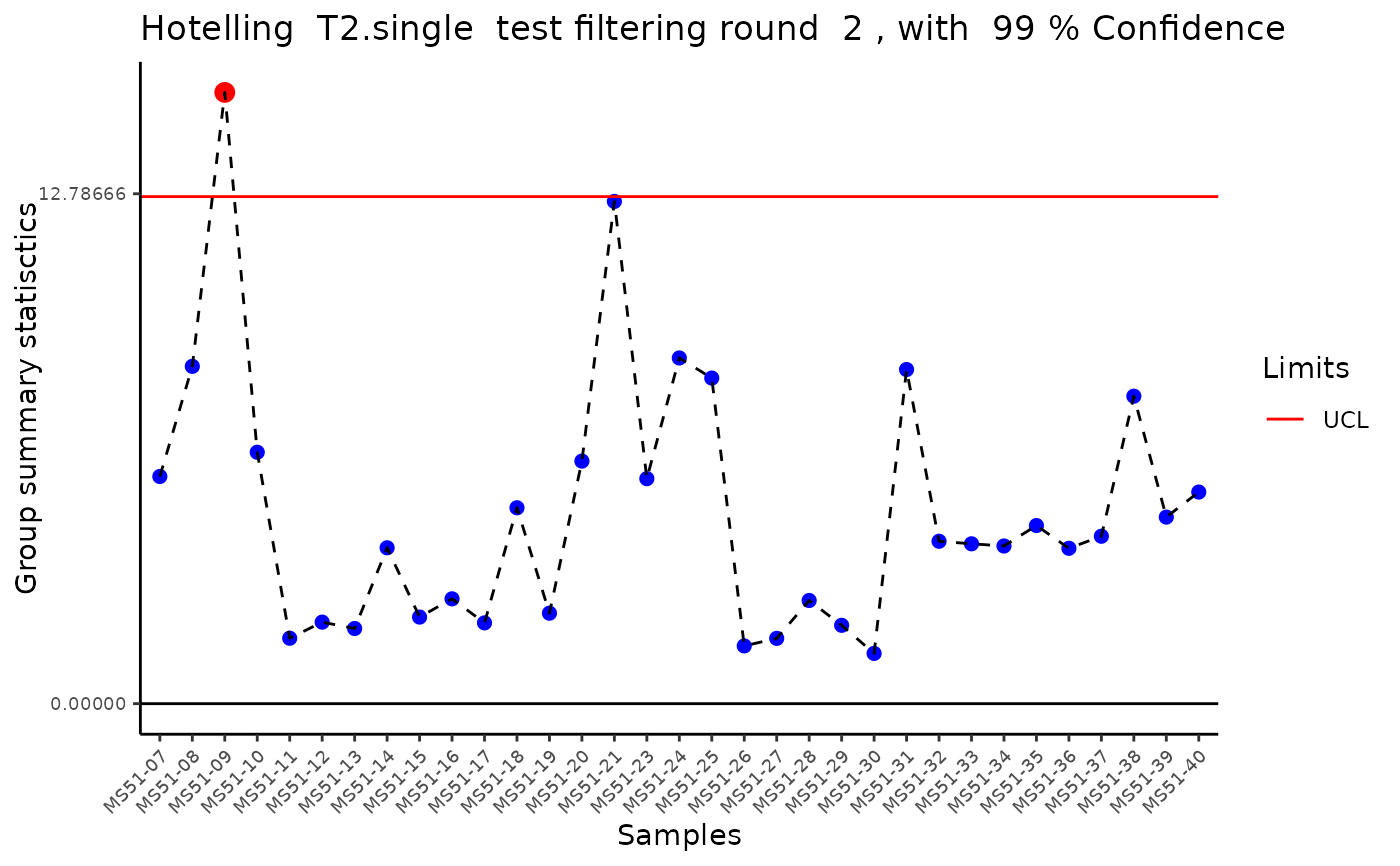
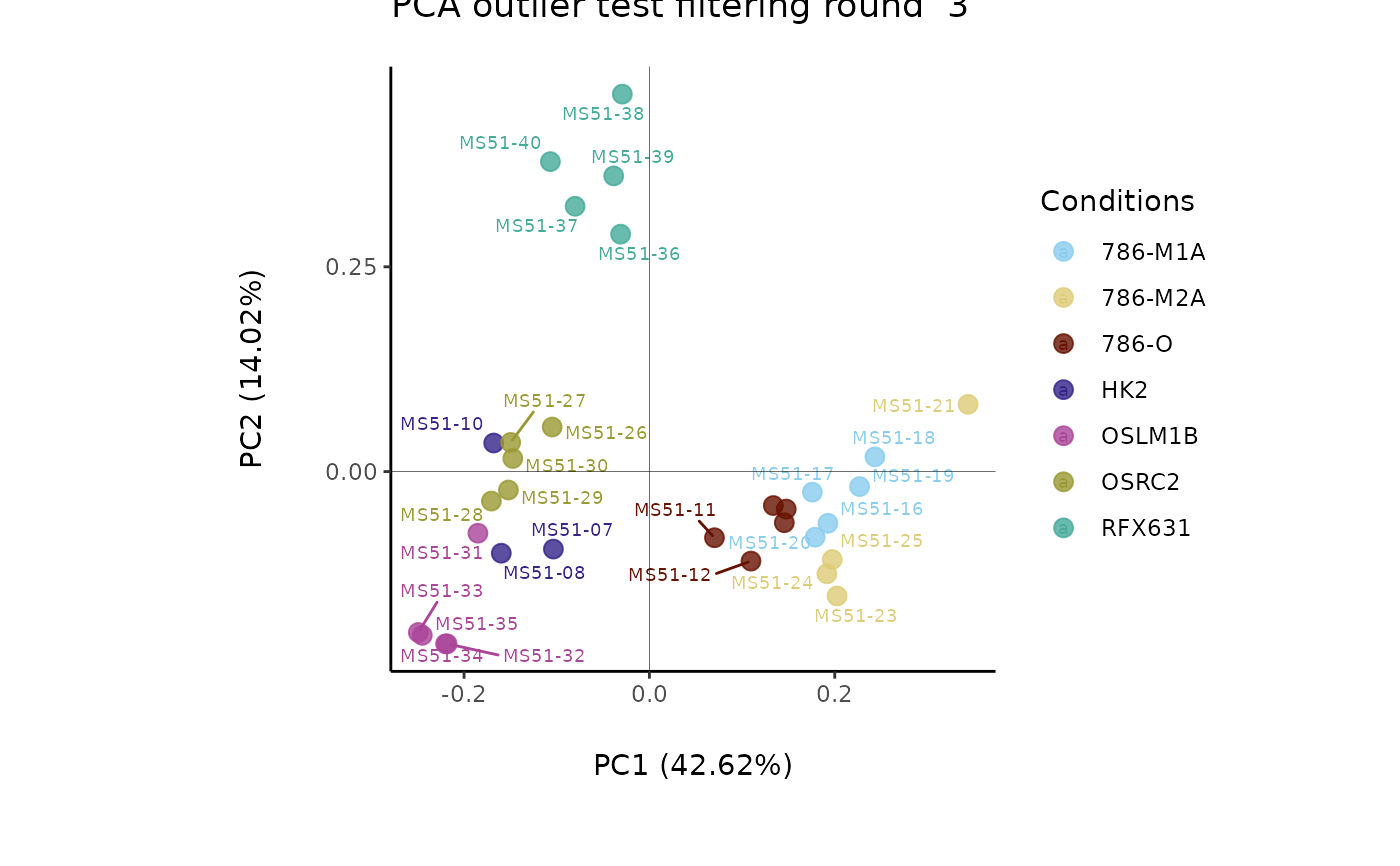
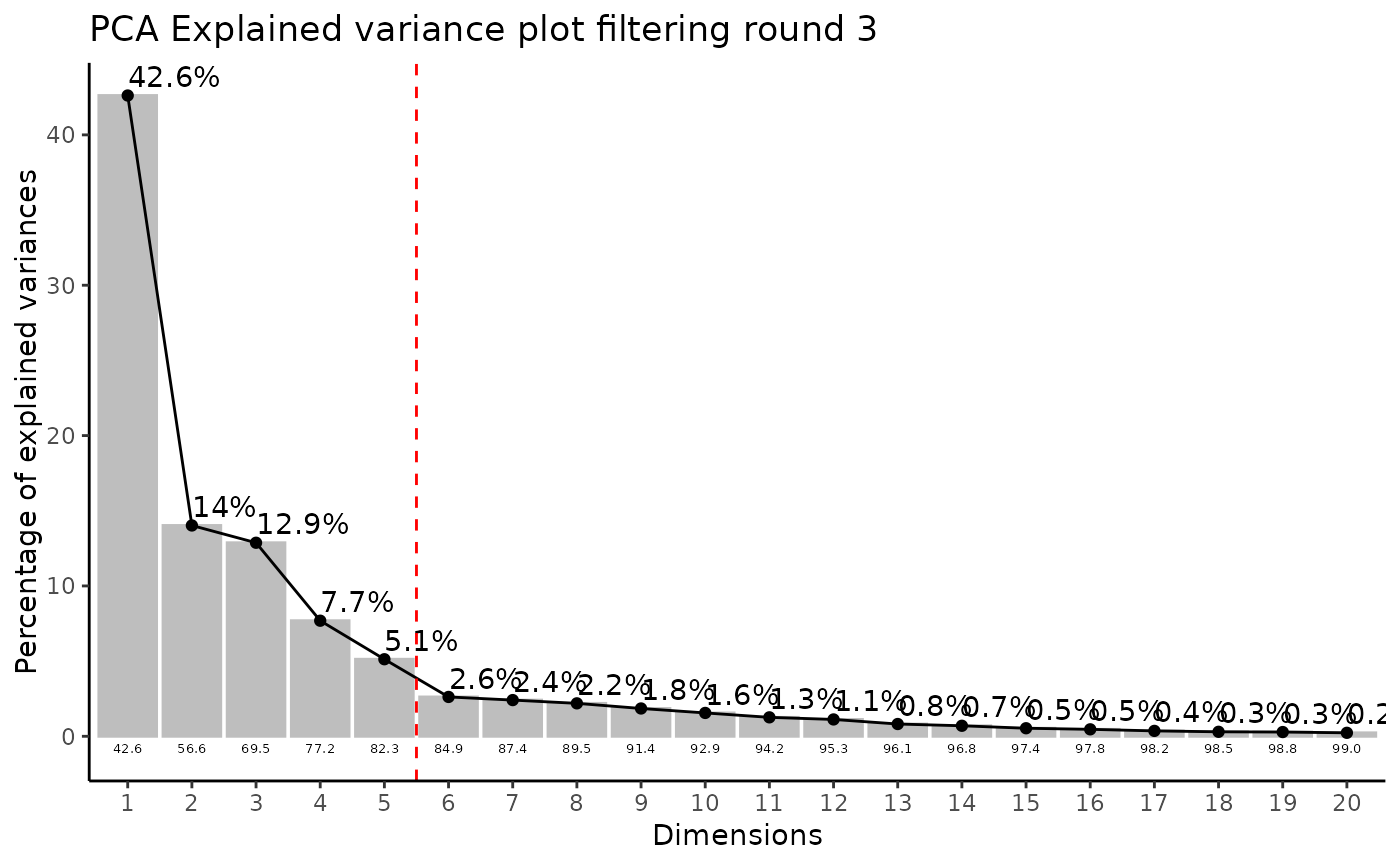
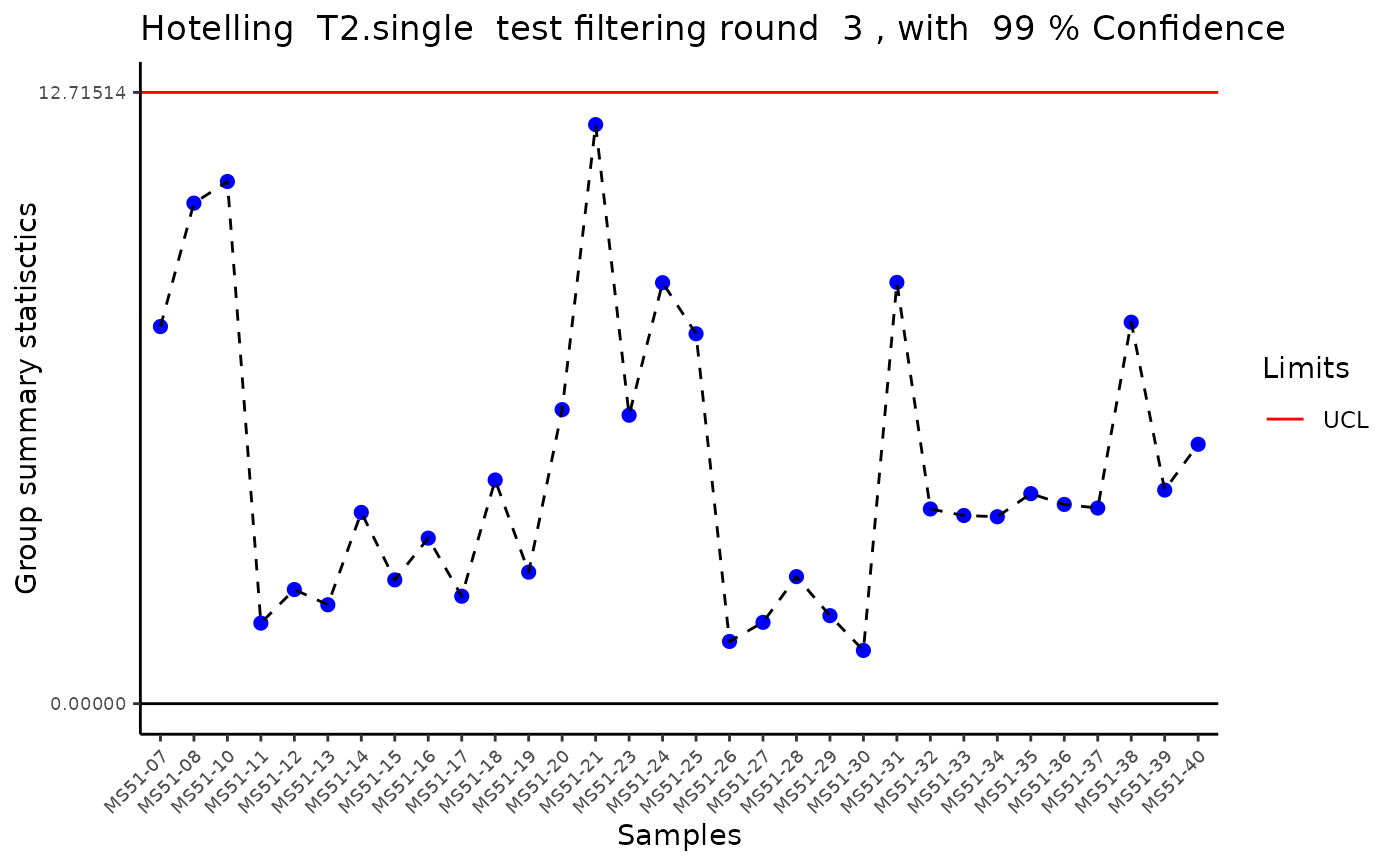
#> Outlier detection: Identification of outlier samples is performed using Hotellin's T2 test to define sample outliers in a mathematical way (Confidence = 0.99 ~ p.val < 0.01) (REF: Hotelling, H. (1931), Annals of Mathematical Statistics. 2 (3), 360-378, doi:https://doi.org/10.1214/aoms/1177732979). HotellinsConfidence value selected: 0.99
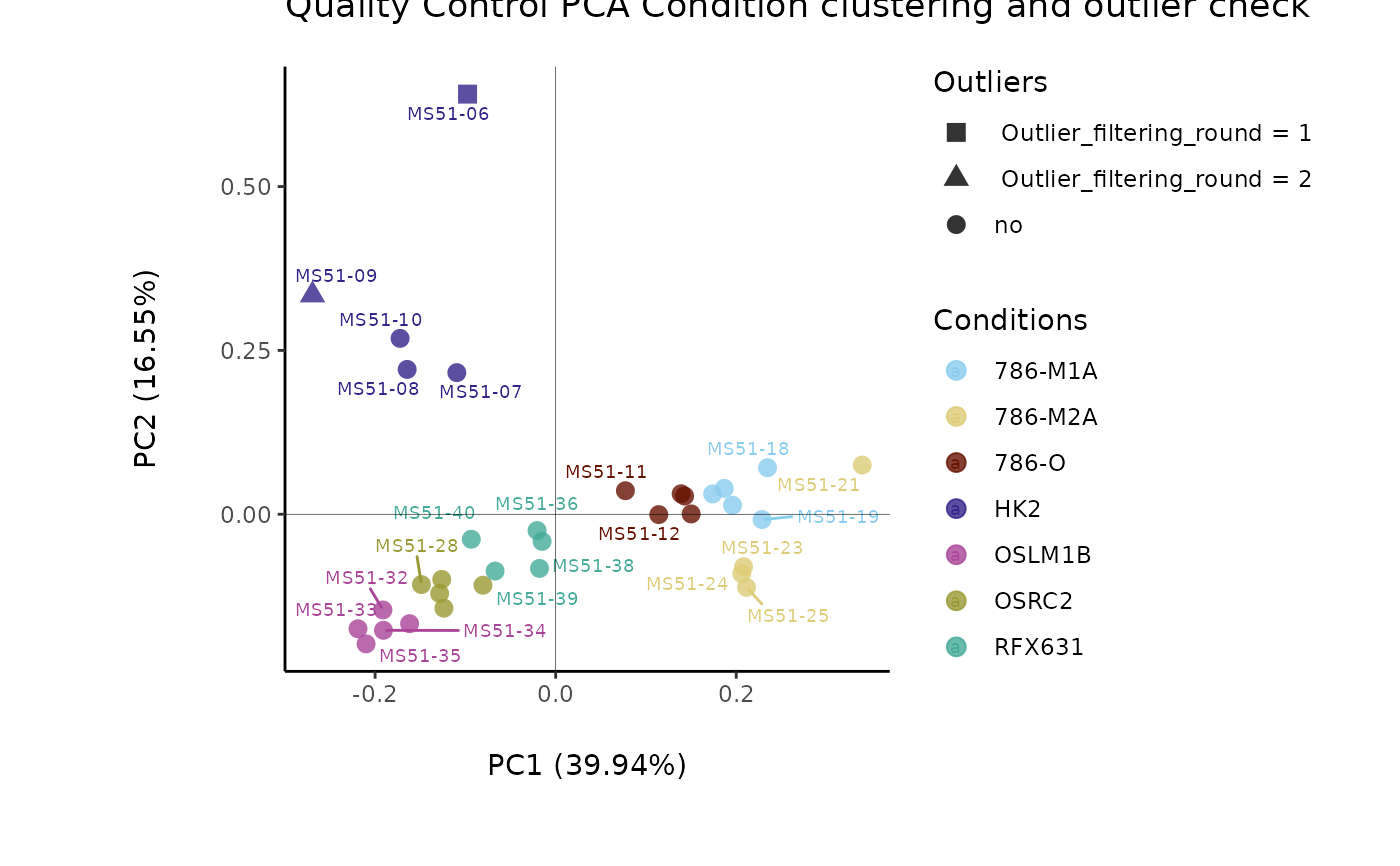
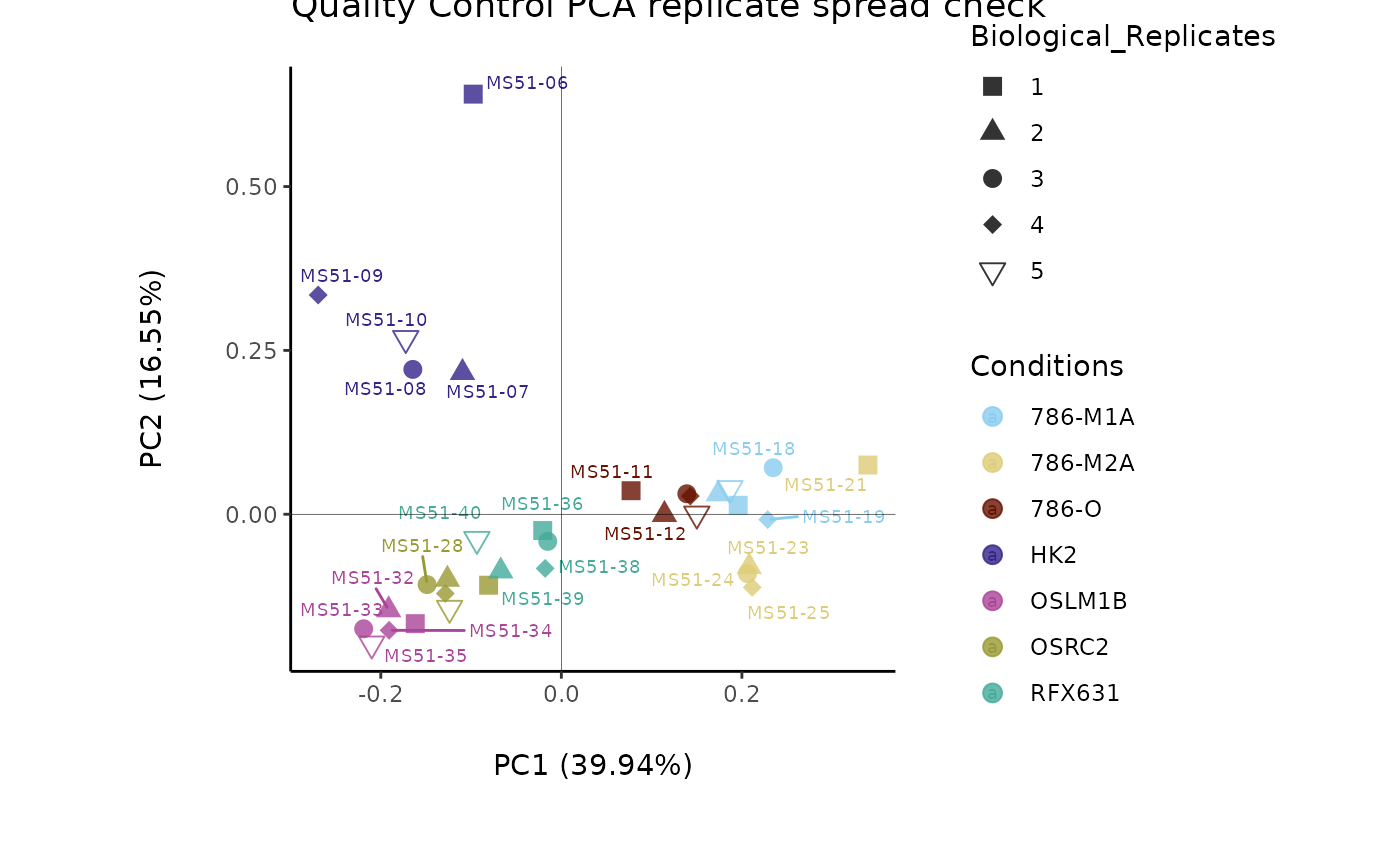
#> There are possible outlier samples in the data
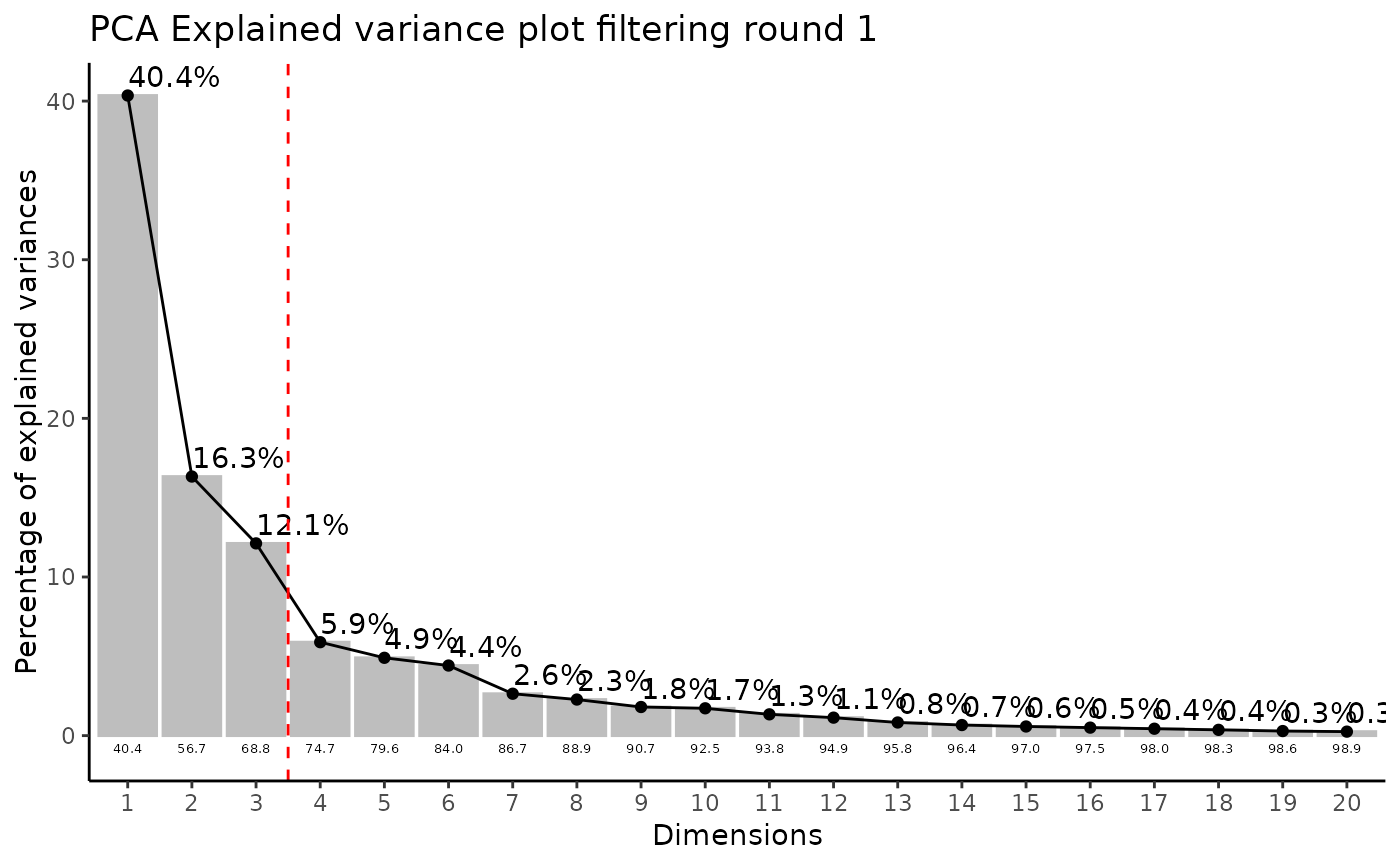
#> Filtering round 1 Outlier Samples: MS51-06
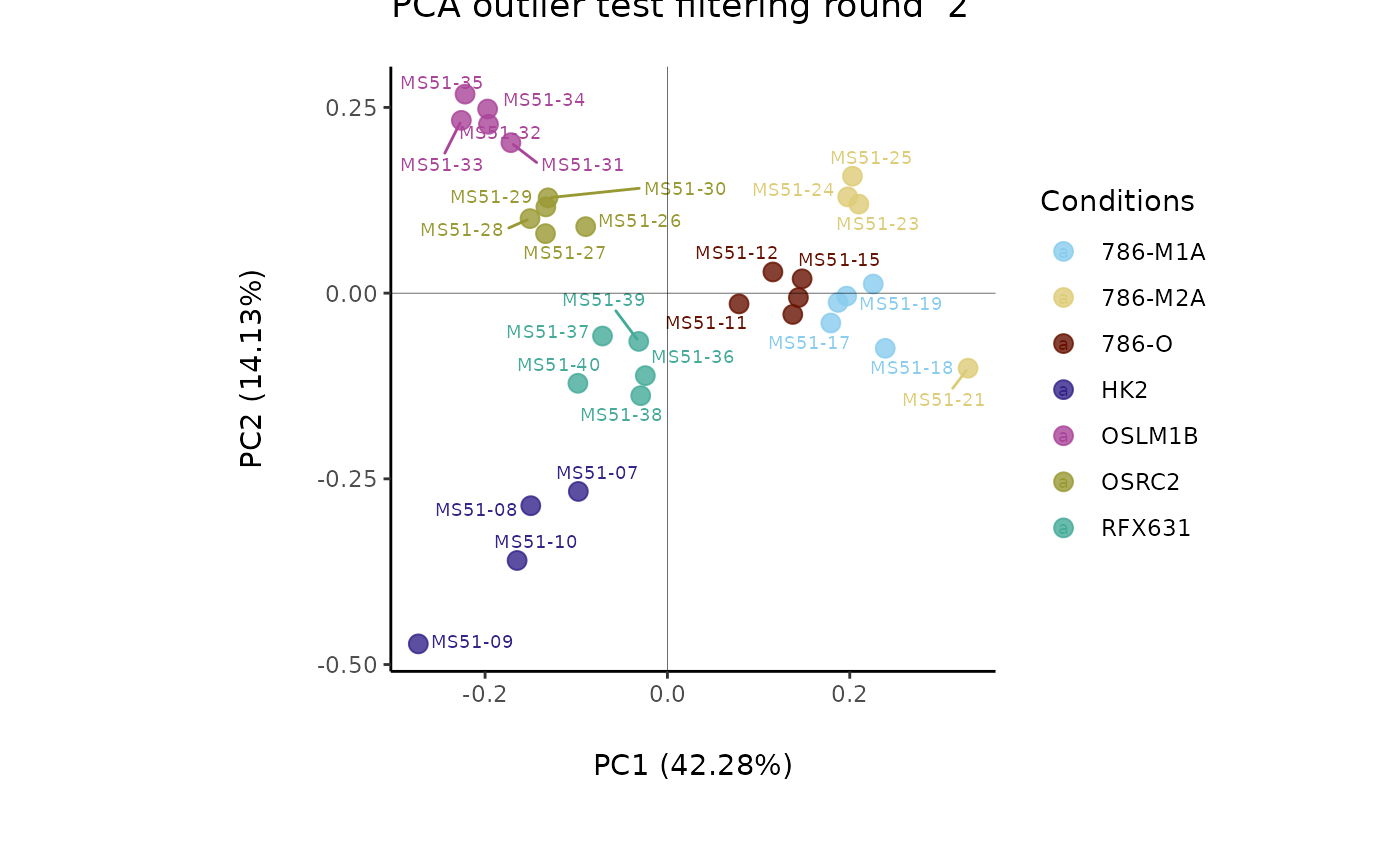
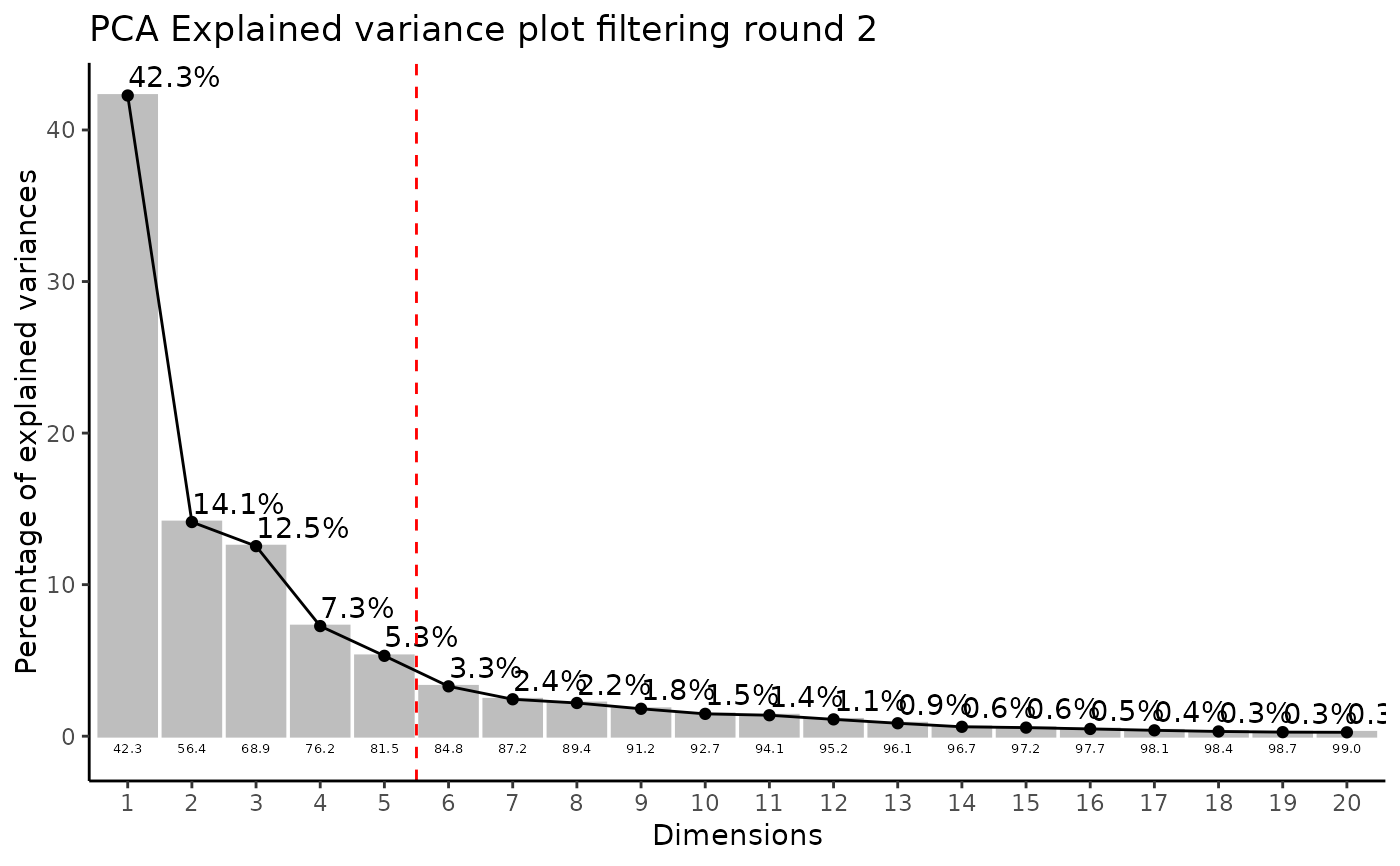
#> Filtering round 2 Outlier Samples: MS51-09
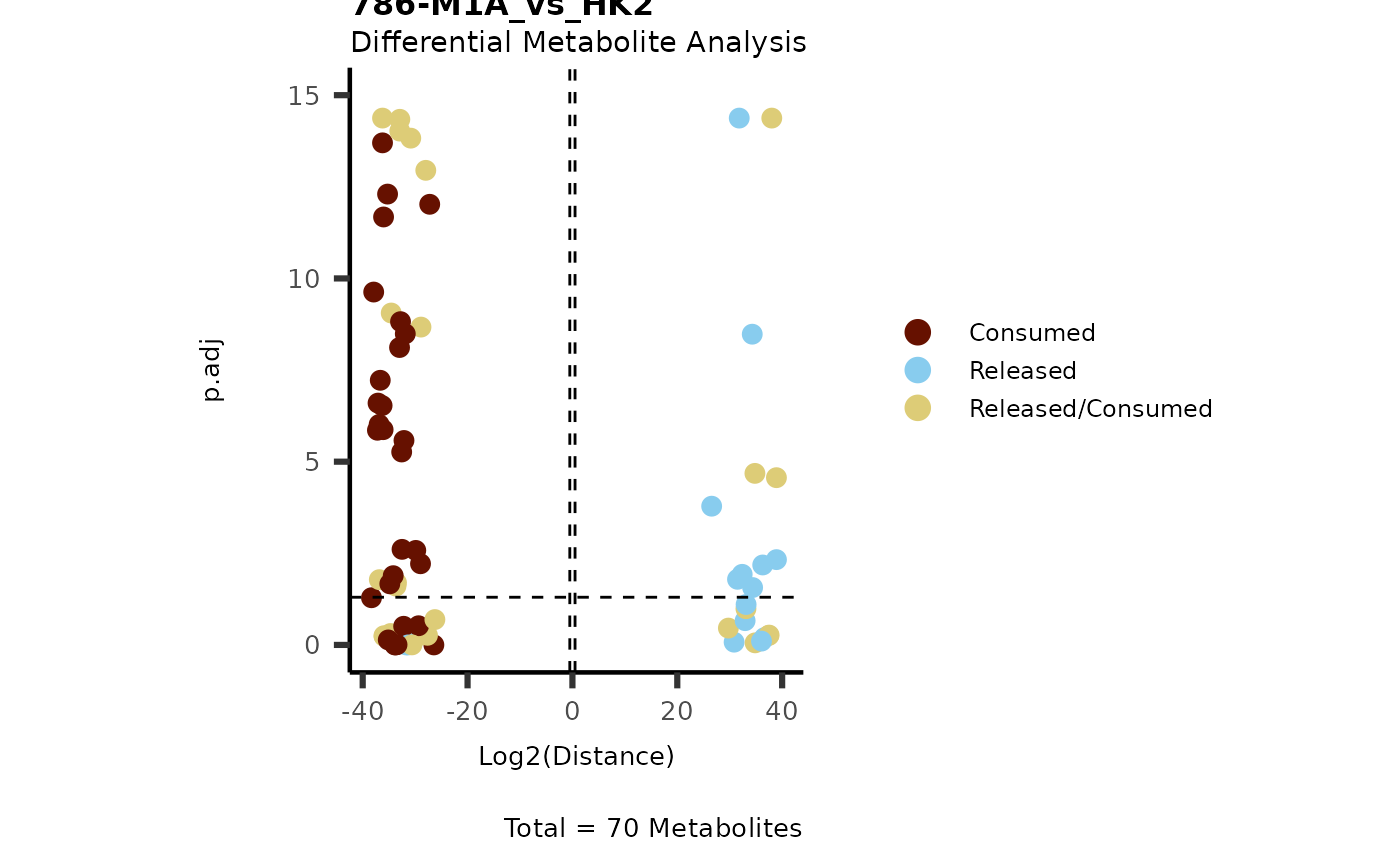
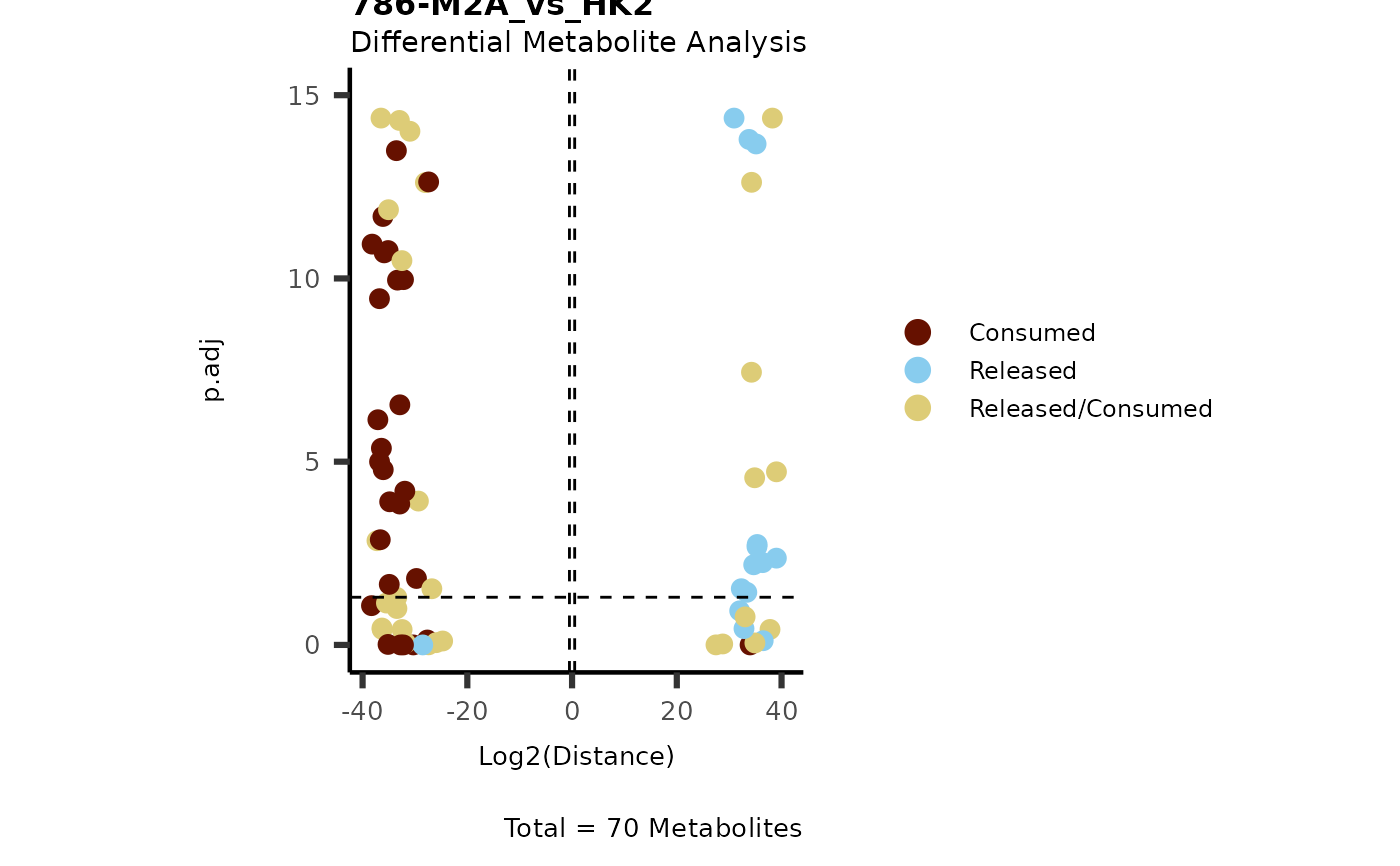
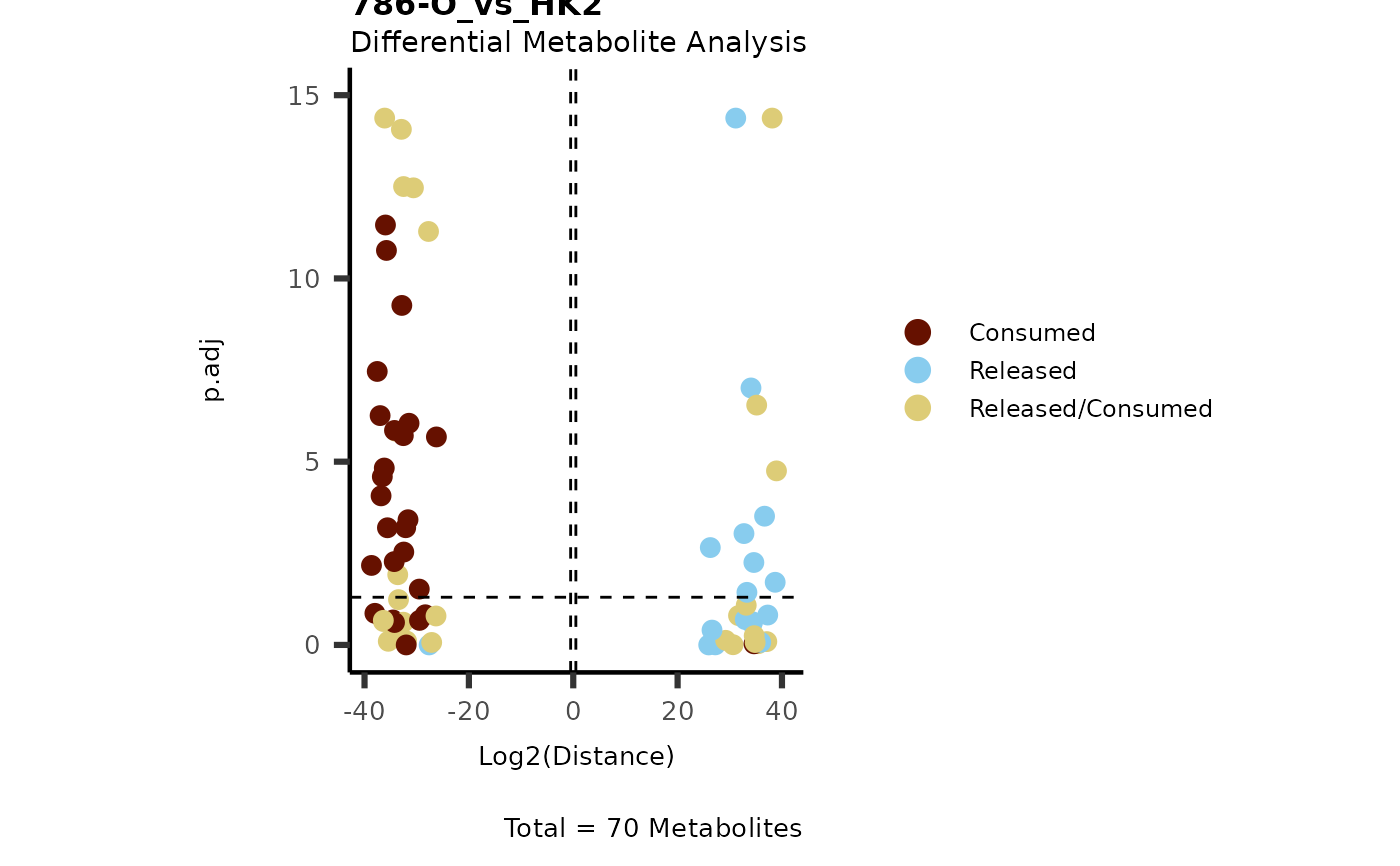
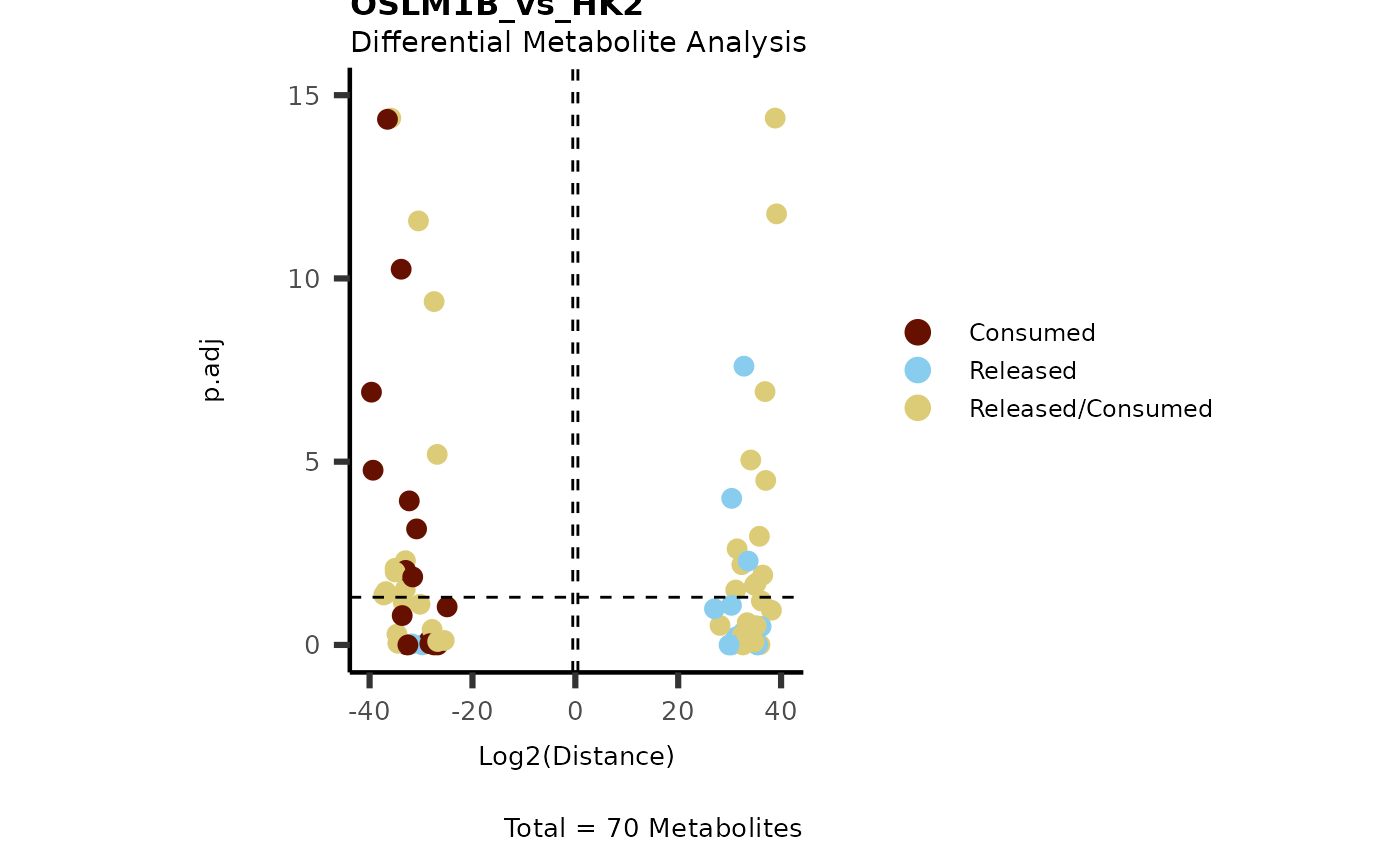
 MediaDMA <- MetaProViz::DMA(InputData=ResM[["DF"]][["Preprocessing_output"]][ ,-c(1:4)],
SettingsFile_Sample=ResM[["DF"]][["Preprocessing_output"]][ , c(1:4)],
SettingsInfo = c(Conditions = "Conditions", Numerator = NULL, Denominator = "HK2"),
StatPval ="aov",
CoRe=TRUE)
#> There are no NA/0 values
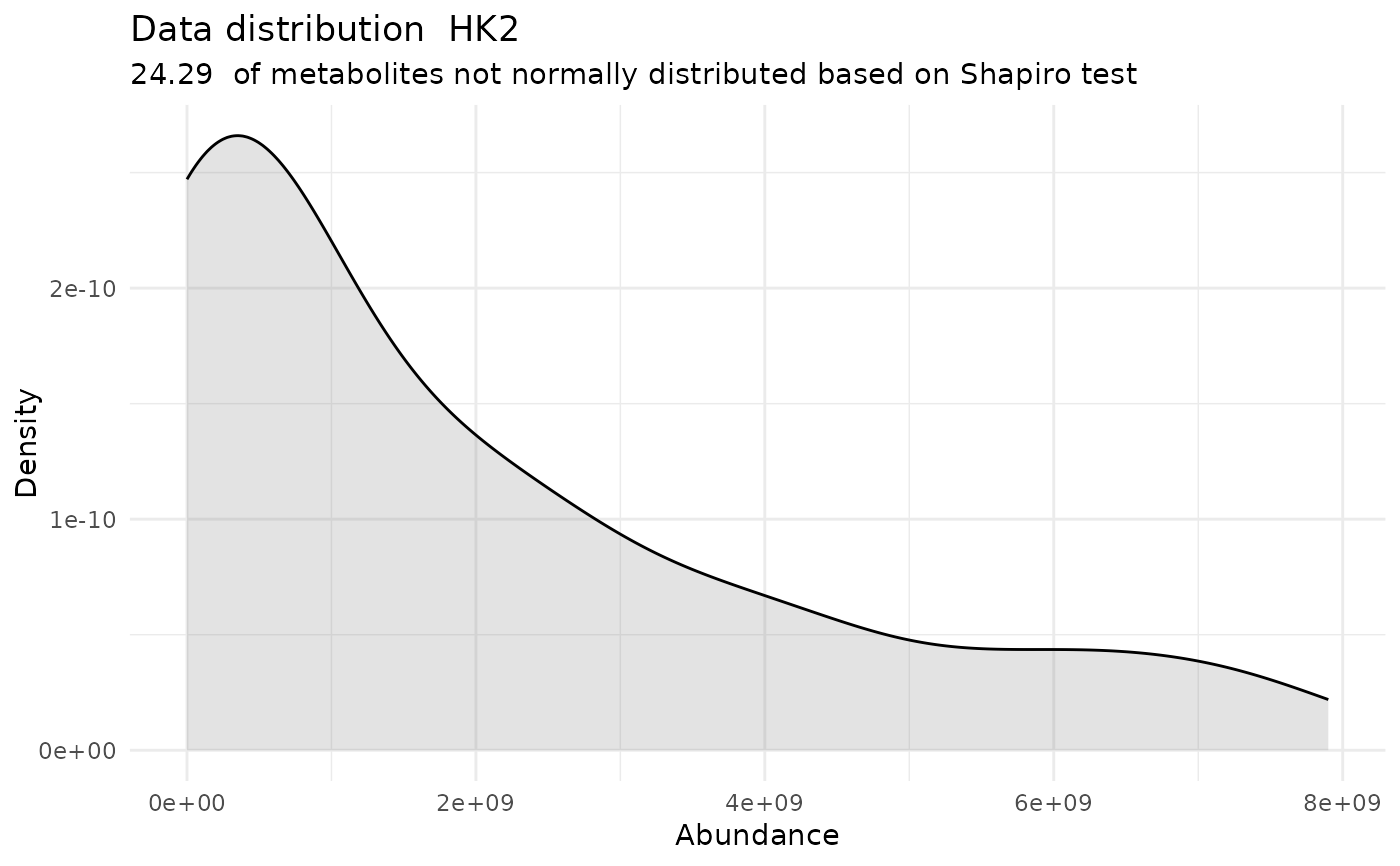
#> For the condition HK2 75.71 % of the metabolites follow a normal distribution and 24.29 % of the metabolites are not-normally distributed according to the shapiro test. You have chosen aov, which is for parametric Hypothesis testing. `shapiro.test` ignores missing values in the calculation.
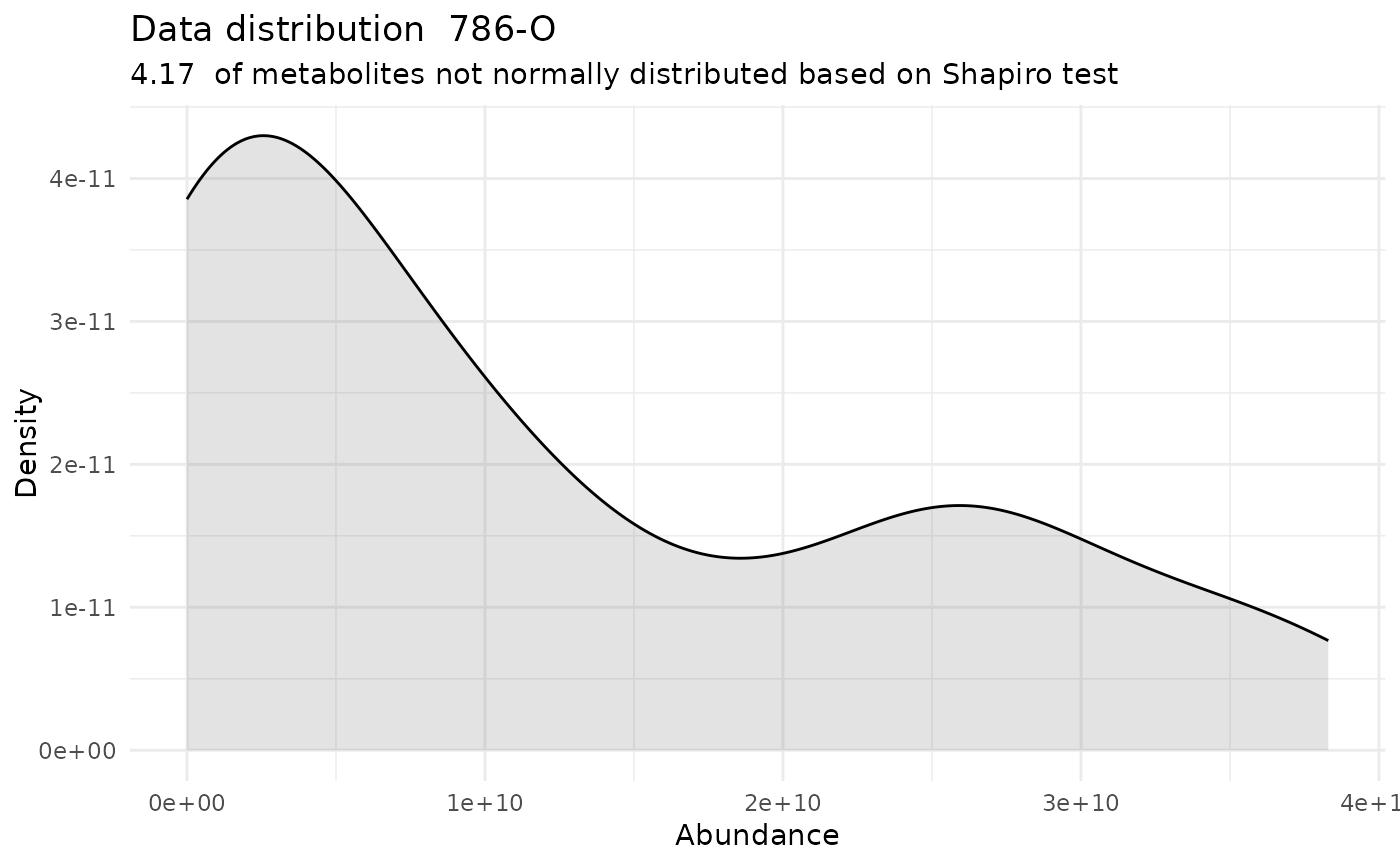
#> For the condition 786-O 95.83 % of the metabolites follow a normal distribution and 4.17 % of the metabolites are not-normally distributed according to the shapiro test. You have chosen aov, which is for parametric Hypothesis testing. `shapiro.test` ignores missing values in the calculation.
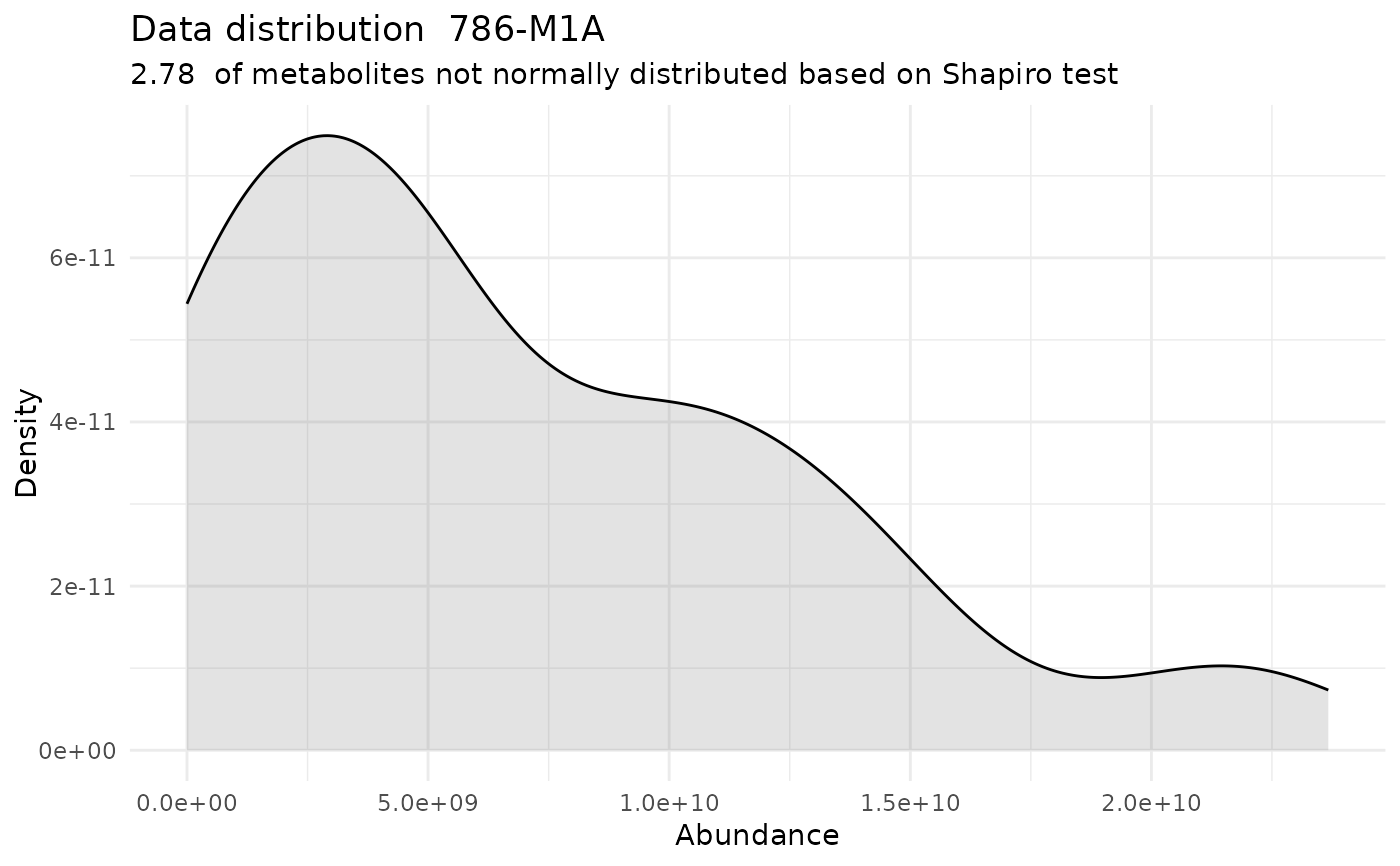
#> For the condition 786-M1A 97.22 % of the metabolites follow a normal distribution and 2.78 % of the metabolites are not-normally distributed according to the shapiro test. You have chosen aov, which is for parametric Hypothesis testing. `shapiro.test` ignores missing values in the calculation.
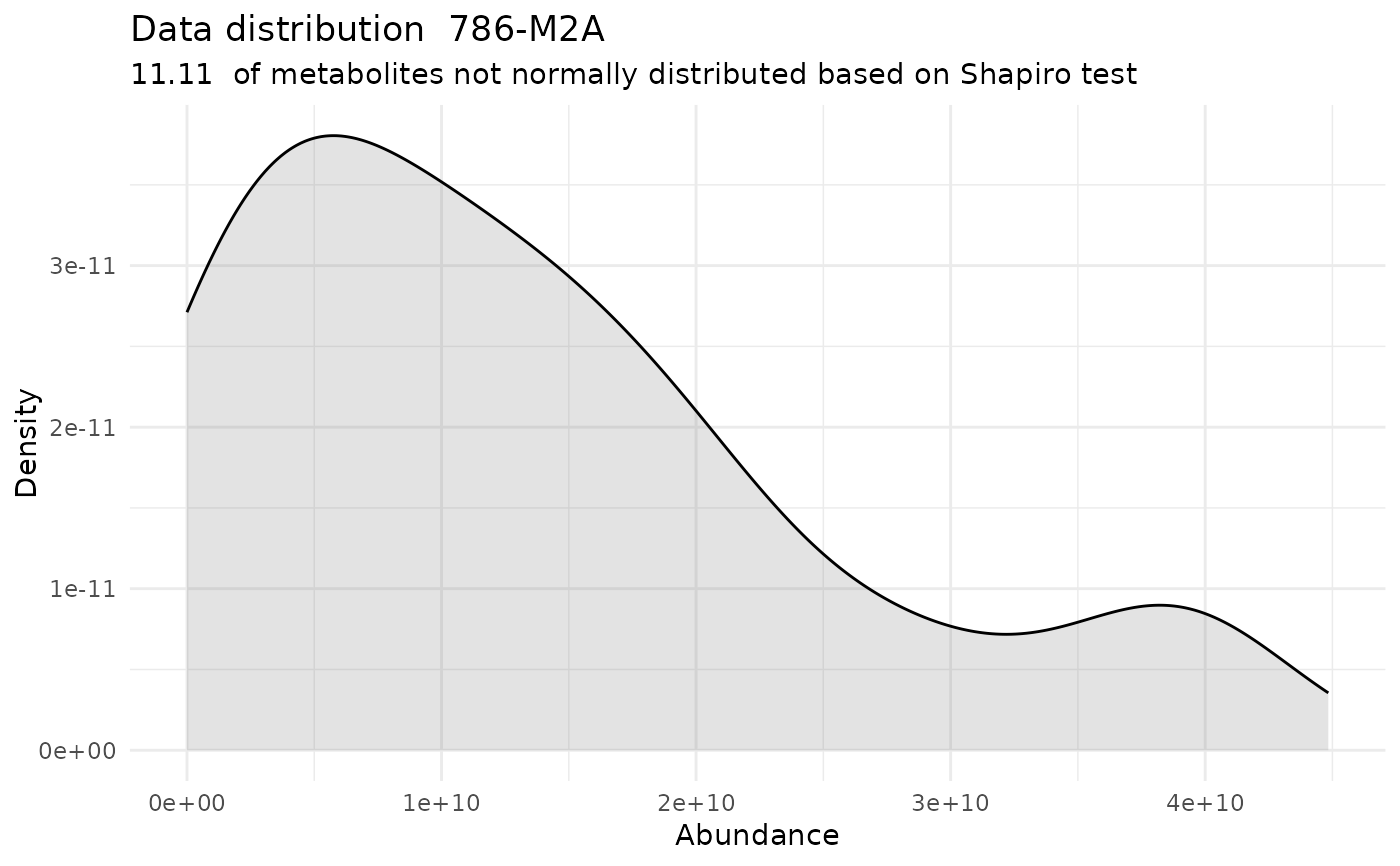
#> For the condition 786-M2A 88.89 % of the metabolites follow a normal distribution and 11.11 % of the metabolites are not-normally distributed according to the shapiro test. You have chosen aov, which is for parametric Hypothesis testing. `shapiro.test` ignores missing values in the calculation.
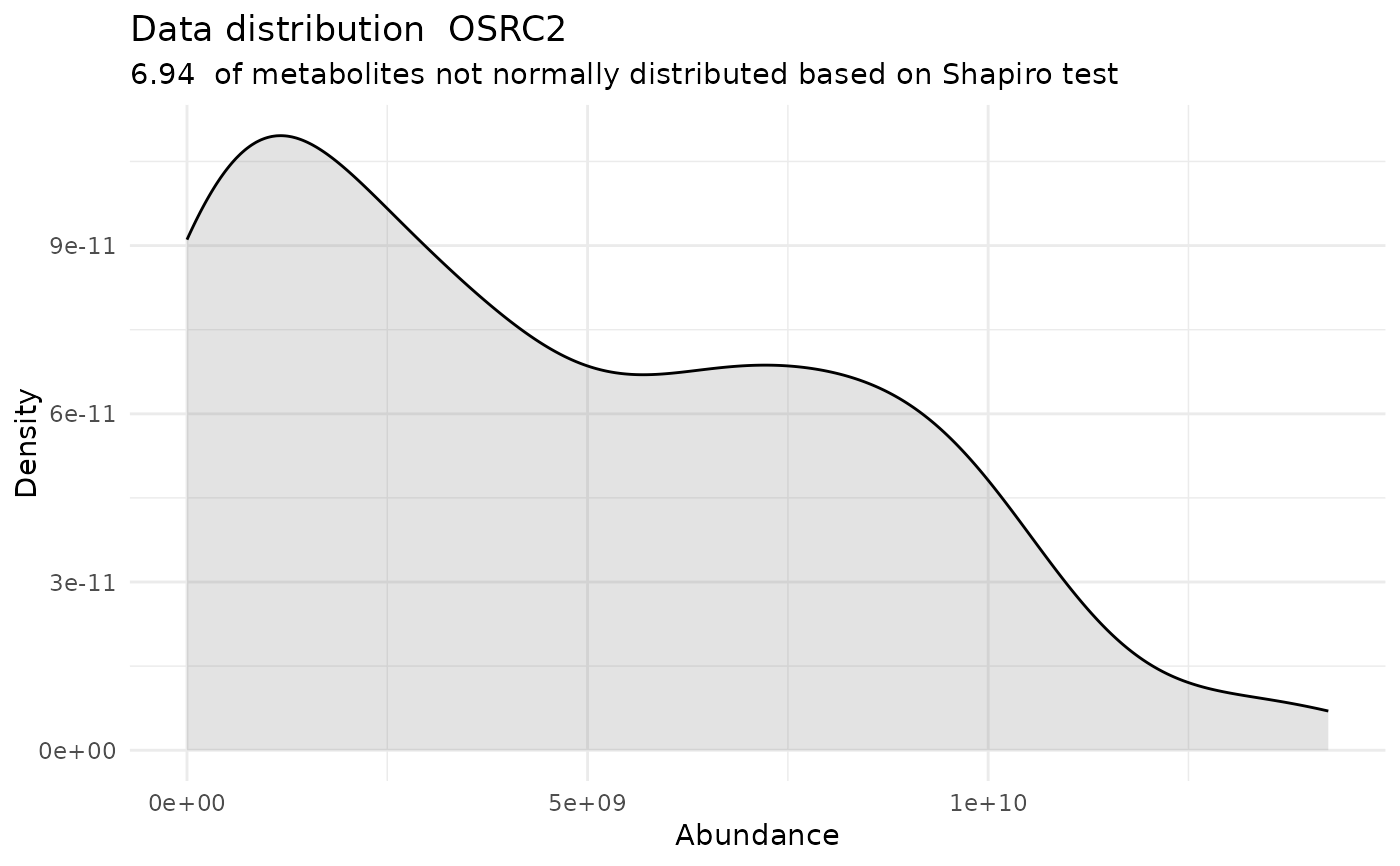
#> For the condition OSRC2 93.06 % of the metabolites follow a normal distribution and 6.94 % of the metabolites are not-normally distributed according to the shapiro test. You have chosen aov, which is for parametric Hypothesis testing. `shapiro.test` ignores missing values in the calculation.
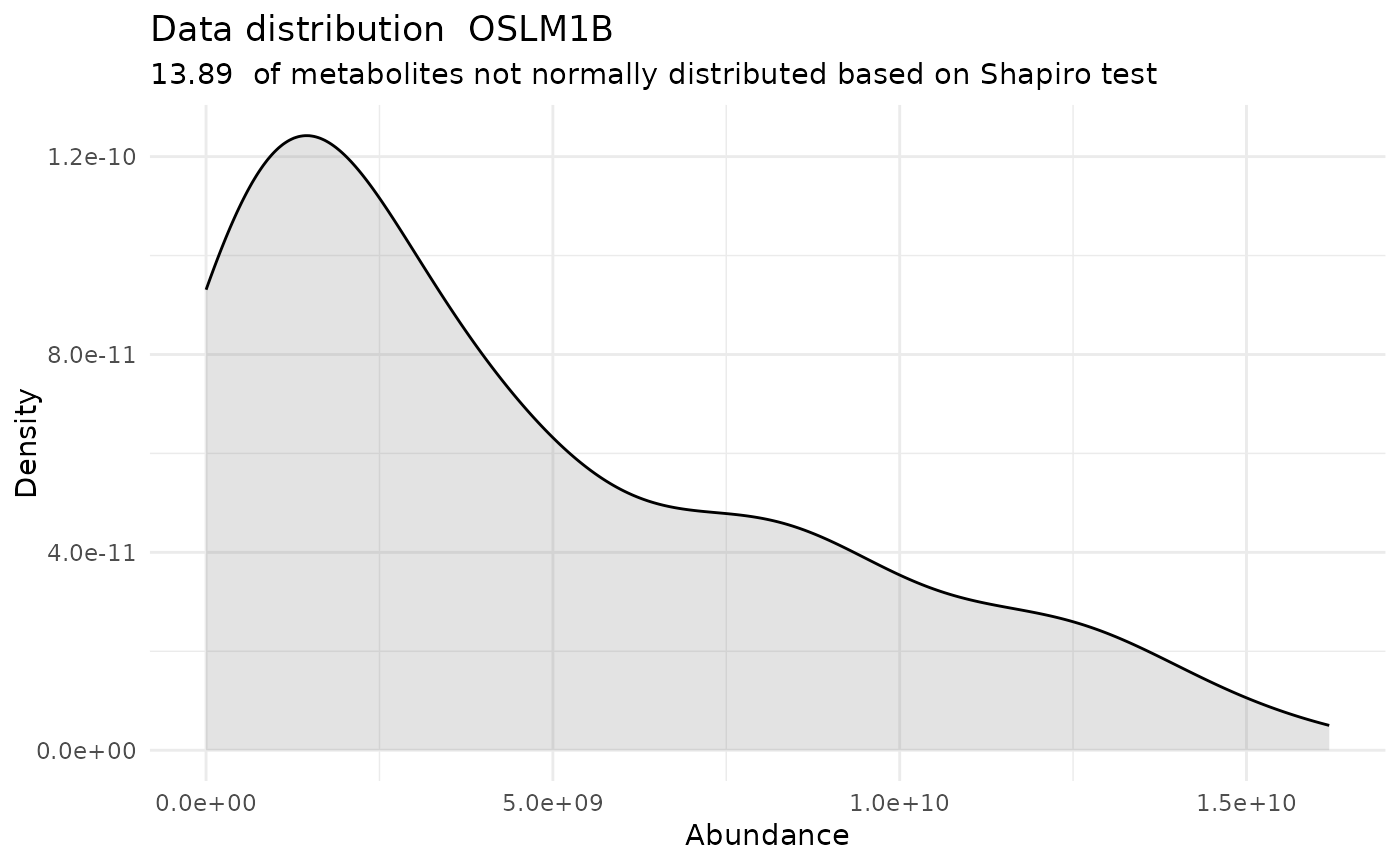
#> For the condition OSLM1B 86.11 % of the metabolites follow a normal distribution and 13.89 % of the metabolites are not-normally distributed according to the shapiro test. You have chosen aov, which is for parametric Hypothesis testing. `shapiro.test` ignores missing values in the calculation.
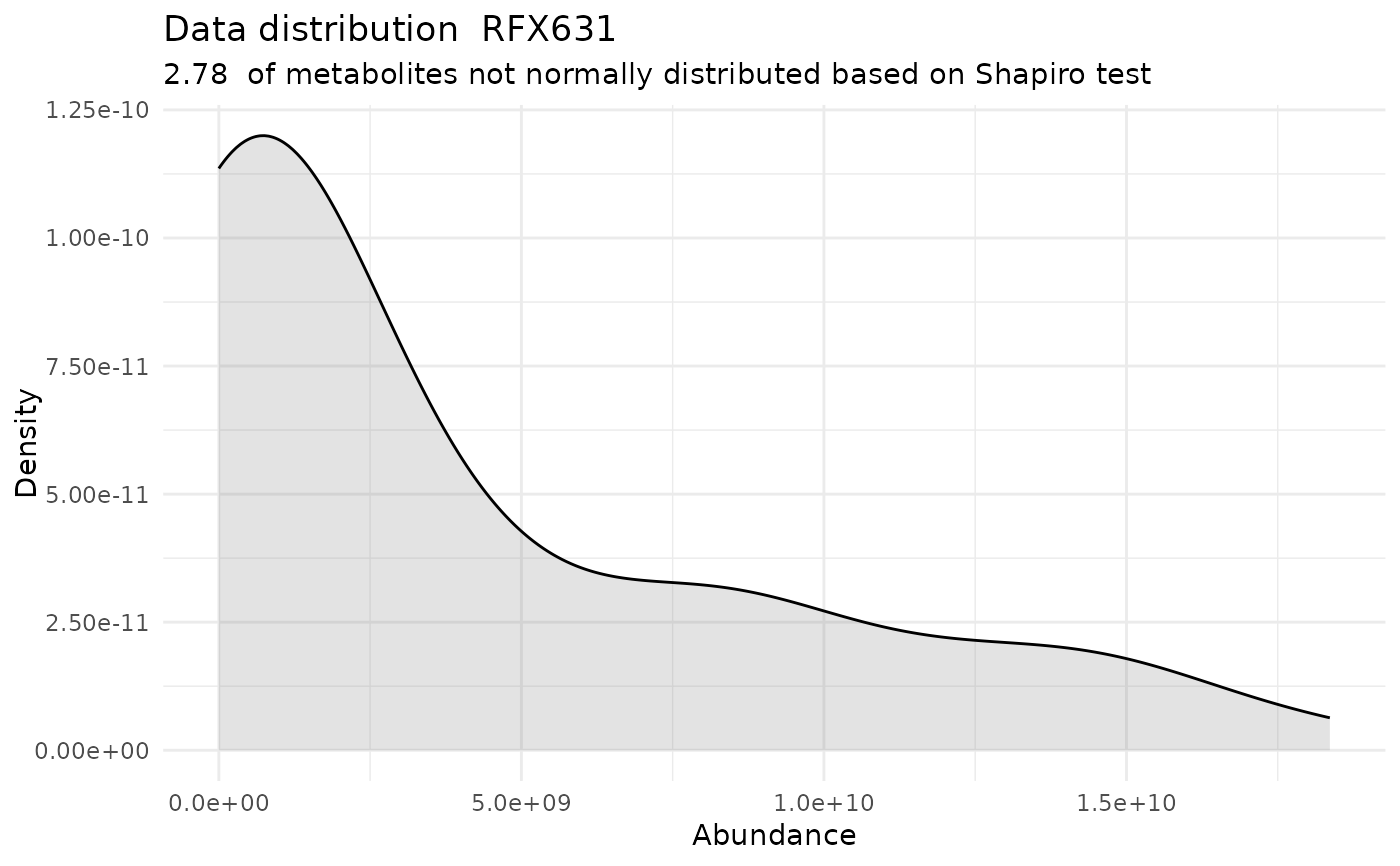
#> For the condition RFX631 97.22 % of the metabolites follow a normal distribution and 2.78 % of the metabolites are not-normally distributed according to the shapiro test. You have chosen aov, which is for parametric Hypothesis testing. `shapiro.test` ignores missing values in the calculation.
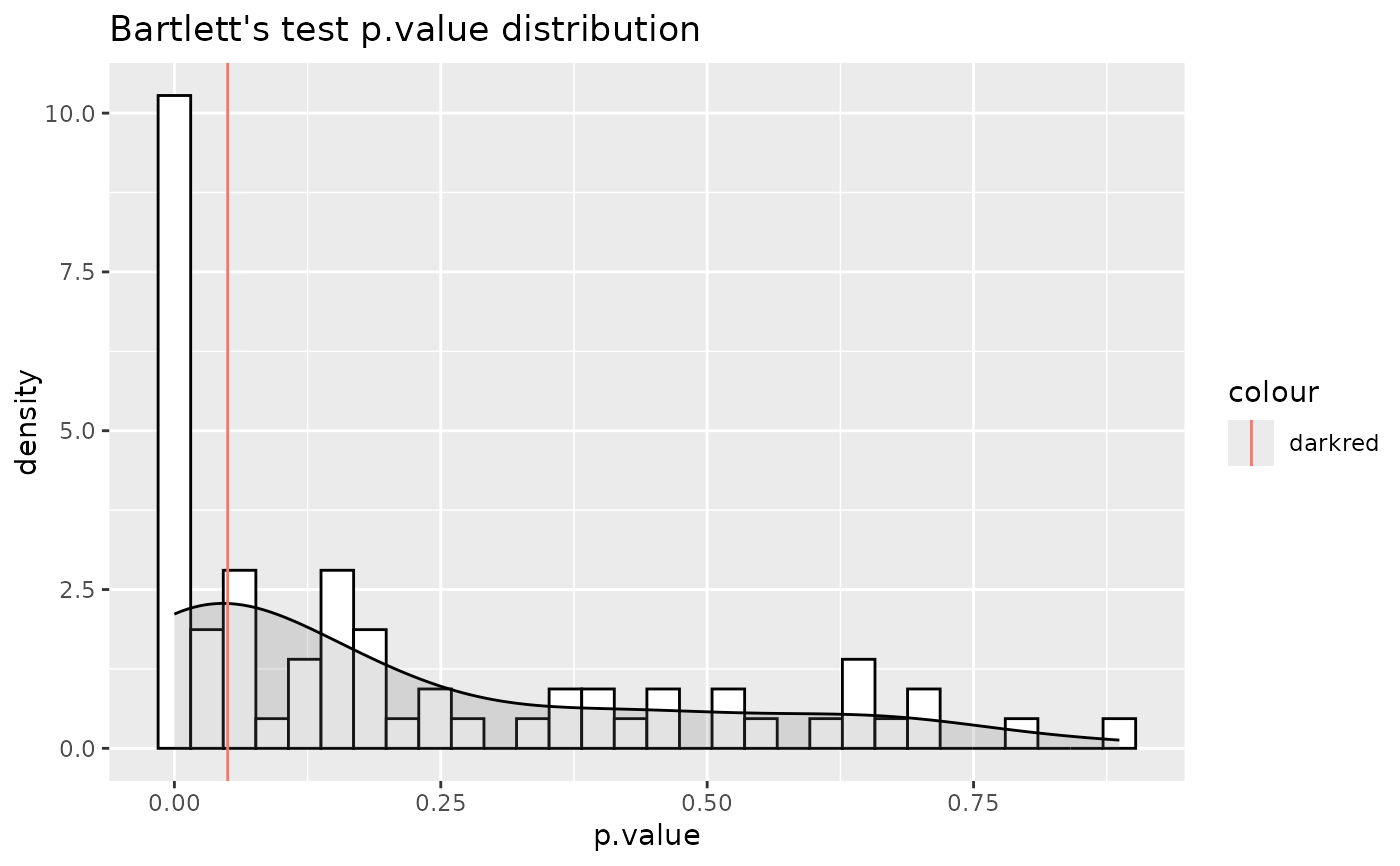
#> For 62.86% of metabolites the group variances are equal.
#> No condition was specified as numerator and HK2 was selected as a denominator. Performing multiple testing `all-vs-one` using aov.
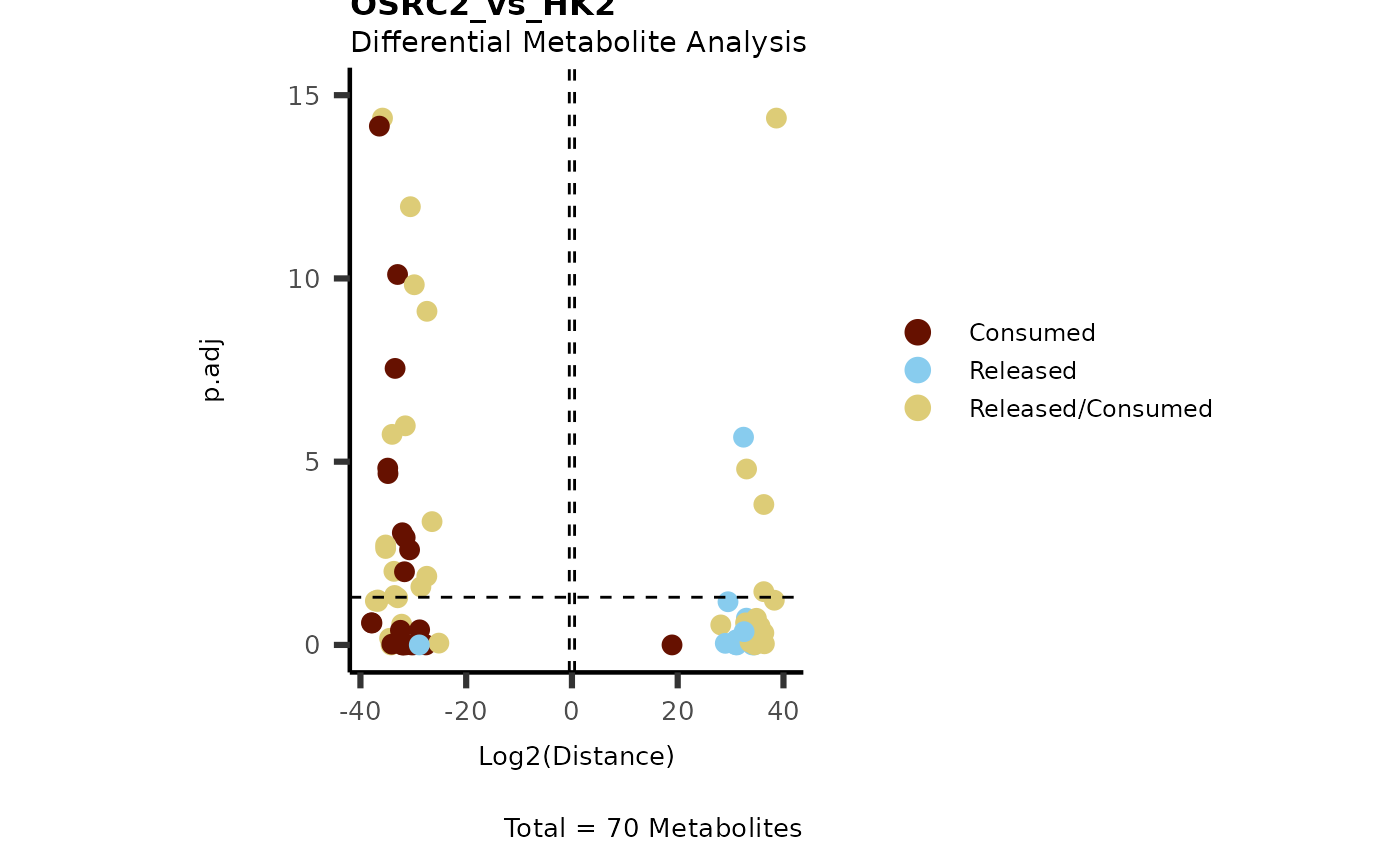
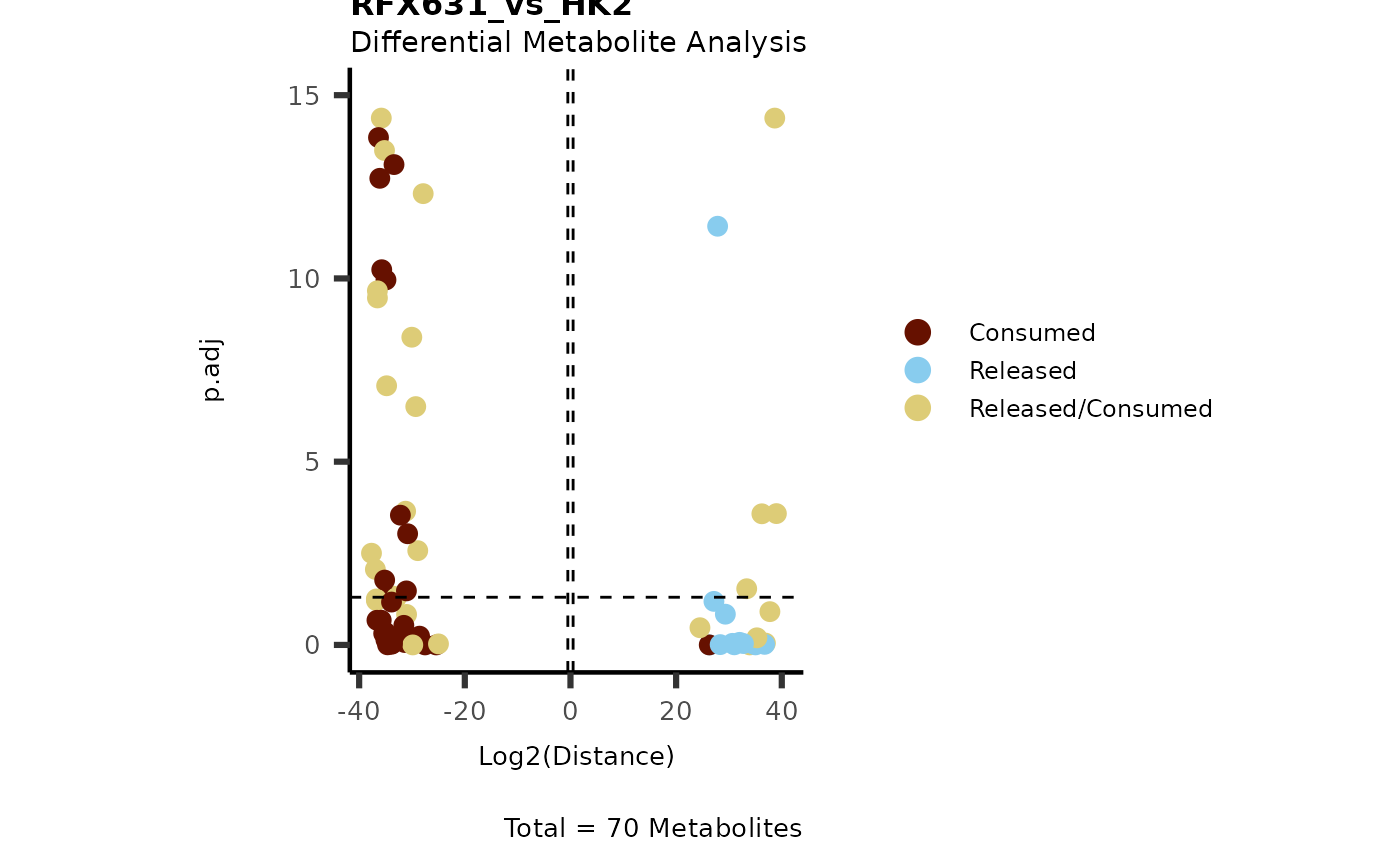 IntraDMA <- MetaProViz::ToyData(Data="IntraCells_DMA")
Res <- MetaProViz::MCA_CoRe(InputData_Intra = IntraDMA%>%tibble::rownames_to_column("Metabolite"),
InputData_CoRe = MediaDMA[["DMA"]][["786-M1A_vs_HK2"]])