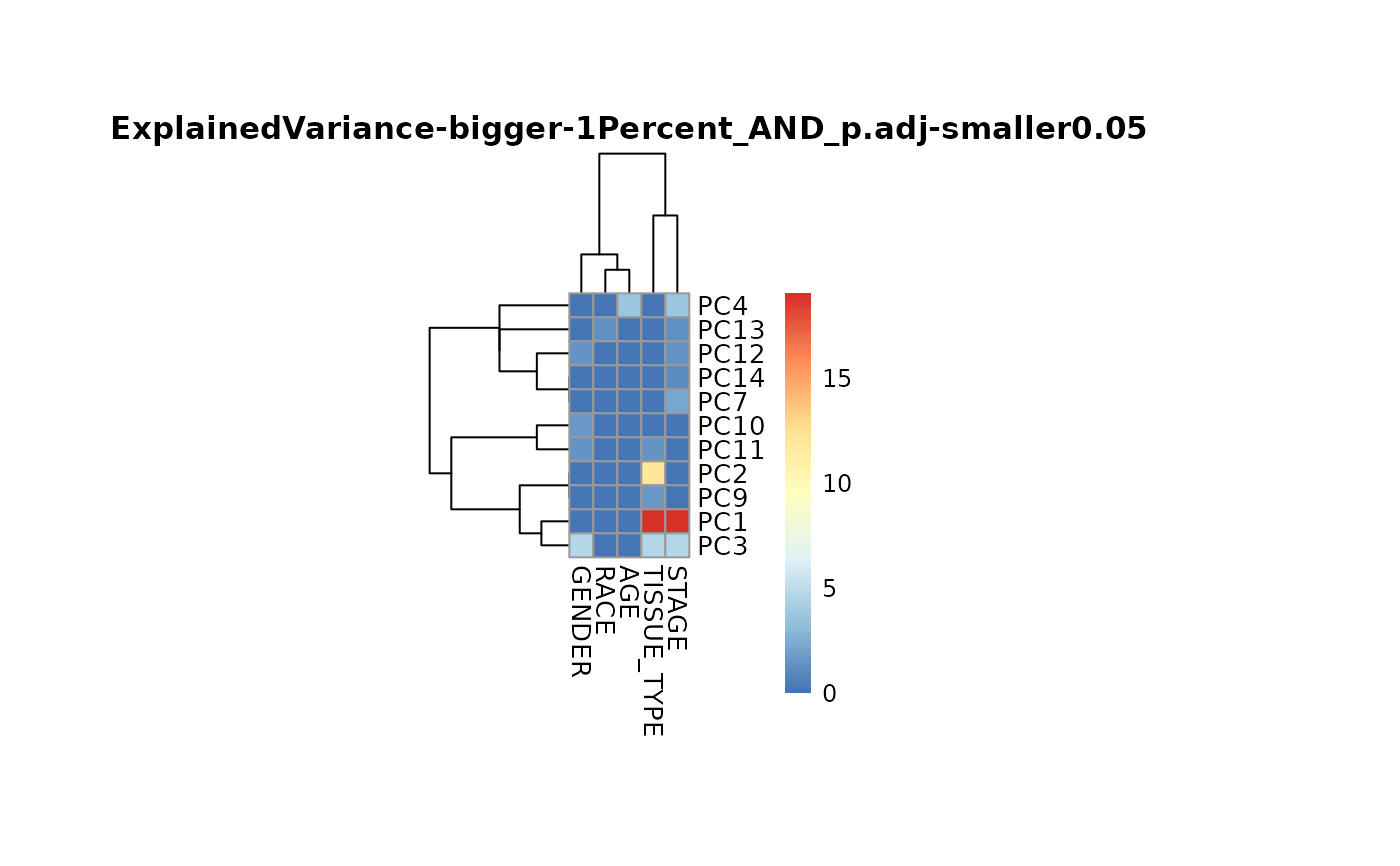
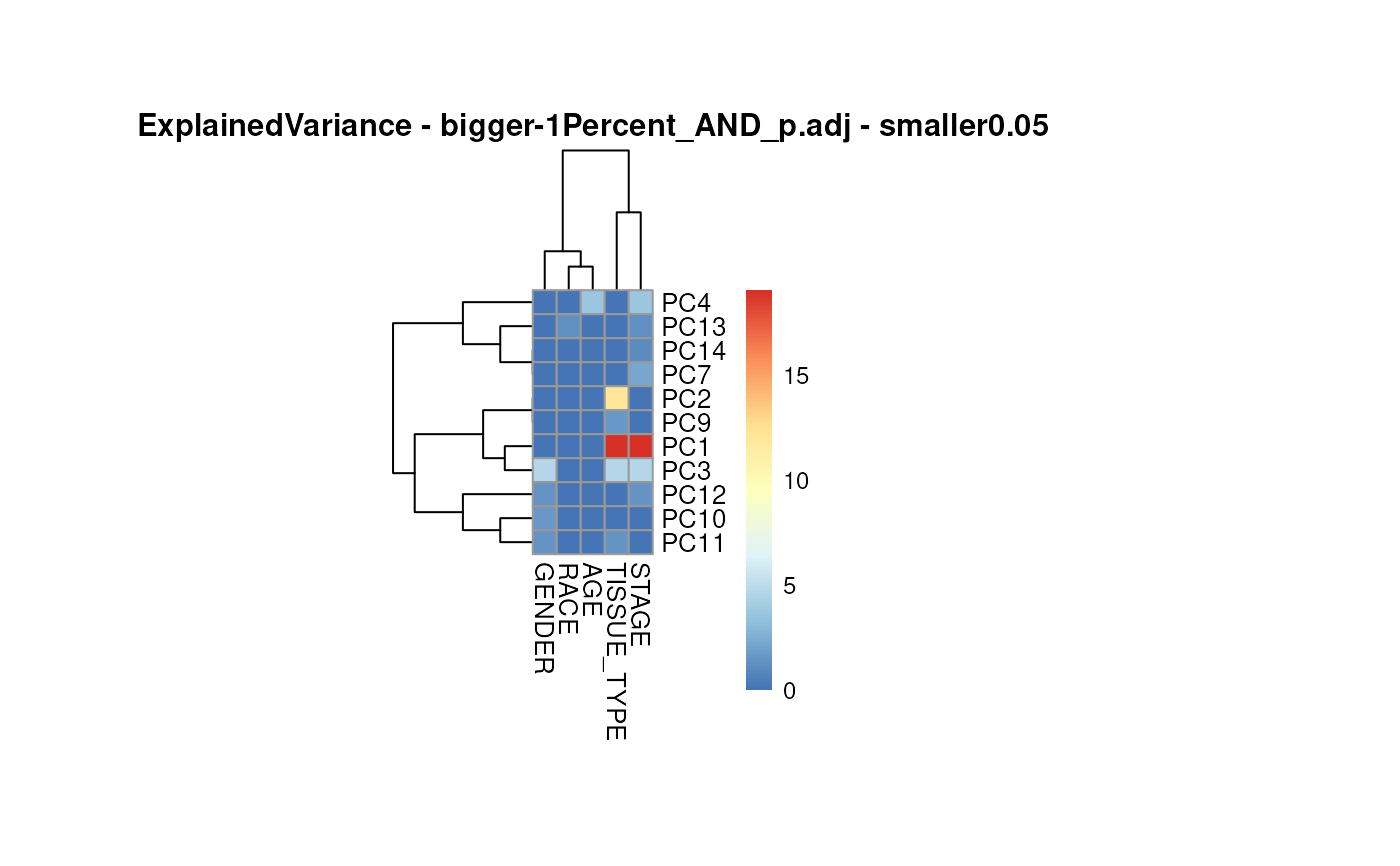
Performs PCA analysis on input data and combines it with sample metadata to run ANOVA tests for identifying significant differences between groups.
Usage
metadata_analysis(
  data,
  metadata_sample = NULL,
  scaling = TRUE,
  percentage = 0.1,
  cutoff_stat = 0.05,
  cutoff_variance = 1,
  save_table = "csv",
  save_plot = "svg",
  print_plot = TRUE,
  path = NULL
)
Arguments
- data
SummarizedExperiment (se) file including assay and colData. If se file is provided, metadata_sample is extracted from the colData of the se object. Alternatively provide a DF with unique sample identifiers as row names and metabolite numerical values in columns with metabolite identifiers as column names. Use NA for metabolites that were not detected.
- metadata_sample
Optional: Only required if you did not provide se file in parameter data. Provide DF which contains metadata information about the samples, which will be combined with your input data based on the unique sample identifiers used as rownames. Default = NULL
- scaling
Optional: TRUE or FALSE for whether a data scaling is used Default = TRUE
- percentage
Optional: percentage of top and bottom features to be displayed in the results summary. Default = 0.1
- cutoff_stat
Optional: Cutoff for the adjusted p-value of the ANOVA test for the results summary and on the heatmap. Default = 0.05
- cutoff_variance
Optional: Cutoff for the PCs variance that should be displayed on the heatmap. Default = 1
- save_table
Optional: File types for the analysis results are: "csv", "xlsx", "txt". Default = "csv"
- save_plot
Optional: Select the file type of output plots. Options are svg, png, pdf. Default = svg
- print_plot
Optional: TRUE or FALSE, if TRUE Volcano plot is saved as an overview of the results. Default = TRUE
- path
Optional: Path to the folder the results should be saved at. default: NULL
Examples
data(tissue_norm_se)
Res <- metadata_analysis(data = tissue_norm_se)
#> The column names of the 'metadata_sample' contain special character that where removed.


data(tissue_norm)
Res <- metadata_analysis(
    data = tissue_norm[, -c(2:14)] %>% tibble::column_to_rownames("Code"),
    metadata_sample = tissue_norm[, c(1, 3, 5:6, 13:14)] %>% tibble::column_to_rownames("Code")
)
#> The column names of the 'metadata_sample' contain special character that where removed.
