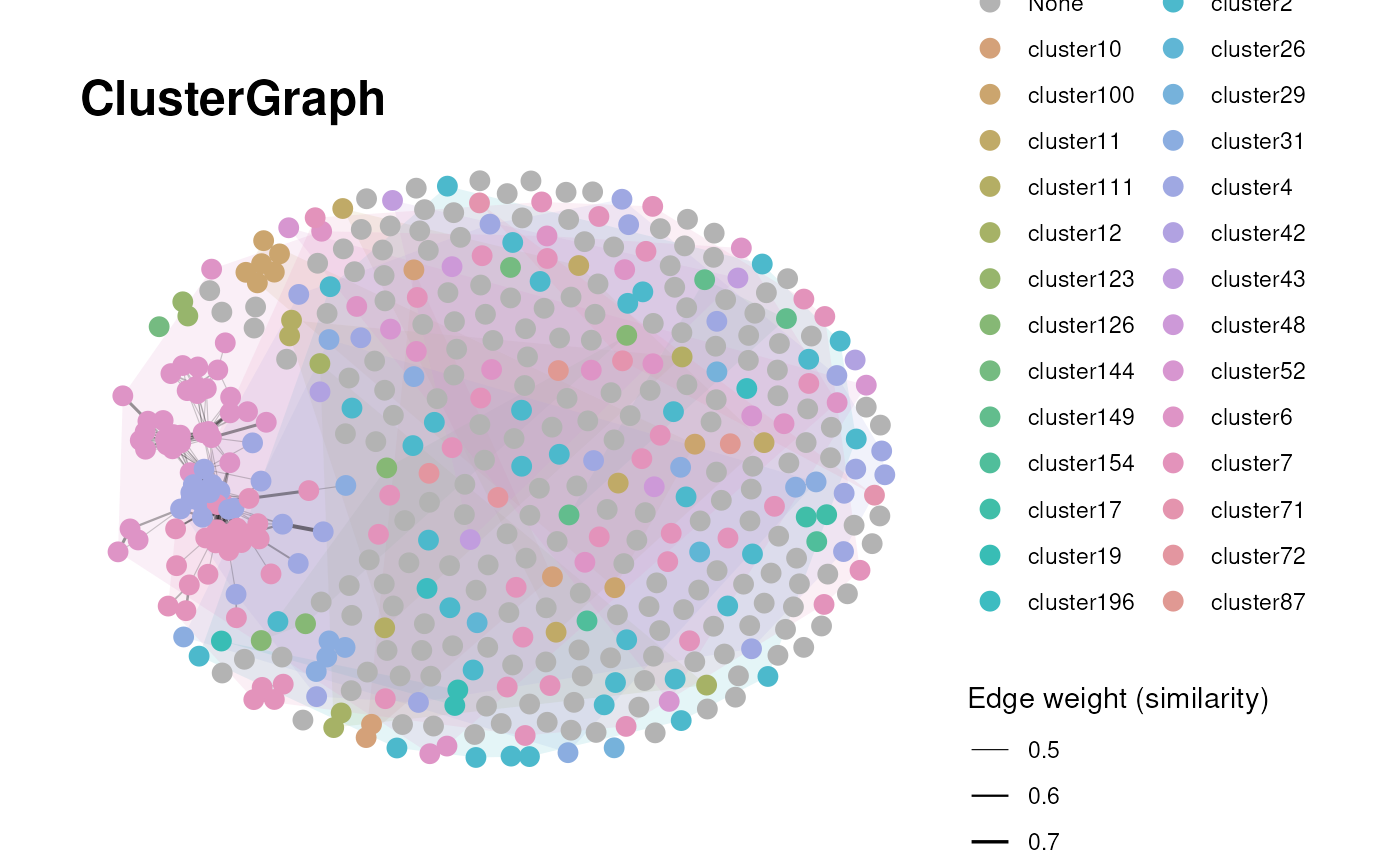
Graph visualization for clustered terms
Usage
viz_graph(
  similarity_matrix,
  clusters,
  plot_threshold = 0.5,
  plot_name = "ClusterGraph",
  max_nodes = NULL,
  min_degree = NULL,
  node_sizes = NULL,
  show_density = FALSE,
  save_plot = "svg",
  print_plot = TRUE,
  path = NULL,
  plot_width = 3000,
  plot_height = 2000,
  plot_unit = "px"
)
Arguments
- similarity_matrix
Square numeric matrix of term similarity values. Row/column names must match
clustersnames.- clusters
Named vector of cluster labels for each term (e.g., "cluster1").
- plot_threshold
Similarity threshold used to define edges. Values below the threshold are removed. Default = 0.5.
- plot_name
Optional: String added to output files of the plot. Default = "ClusterGraph".
- max_nodes
Optional: Maximum nodes for plotting. If set, keeps nodes from the largest component up to this limit (by degree).
- min_degree
Optional: Minimum degree filter for graph plotting.
- node_sizes
Optional: Named numeric vector of node sizes, with names matching term IDs. Values are scaled for plotting.
- show_density
Optional: If TRUE, add a hull background per cluster. Default = FALSE.
- save_plot
Optional: Select the file type of output plots. Options are svg, pdf, png or NULL. Default = "svg"
- print_plot
Optional: If TRUE prints an overview of resulting plots. Default = TRUE
- path
Optional: String which is added to the resulting folder name. default: NULL
- plot_width
Optional: Plot width passed to
save_res. Default = 3000.- plot_height
Optional: Plot height passed to
save_res. Default = 2000.- plot_unit
Optional: Unit for plot dimensions passed to
save_res. Default = "px".
Examples
# Create toy similarity matrix and clusters
sim <- matrix(
    c(1, 0.8, 0.3, 0.1,
      0.8, 1, 0.2, 0.1,
      0.3, 0.2, 1, 0.7,
      0.1, 0.1, 0.7, 1),
    nrow = 4,
    dimnames = list(
        c("Pathway_A", "Pathway_B", "Pathway_C", "Pathway_D"),
        c("Pathway_A", "Pathway_B", "Pathway_C", "Pathway_D")
    )
)
clusters <- c(
    Pathway_A = "1", Pathway_B = "1",
    Pathway_C = "2", Pathway_D = "2"
)
viz_graph(
    sim, clusters,
    plot_threshold = 0.2,
    save_plot = NULL,
    print_plot = FALSE
)
#> Warning: No shared levels found between `names(values)` of the manual scale and the
#> data's fill values.