This script allows you to perform PCA plot visualization using the results of the MetaProViz analysis
Source:R/VizPCA.R
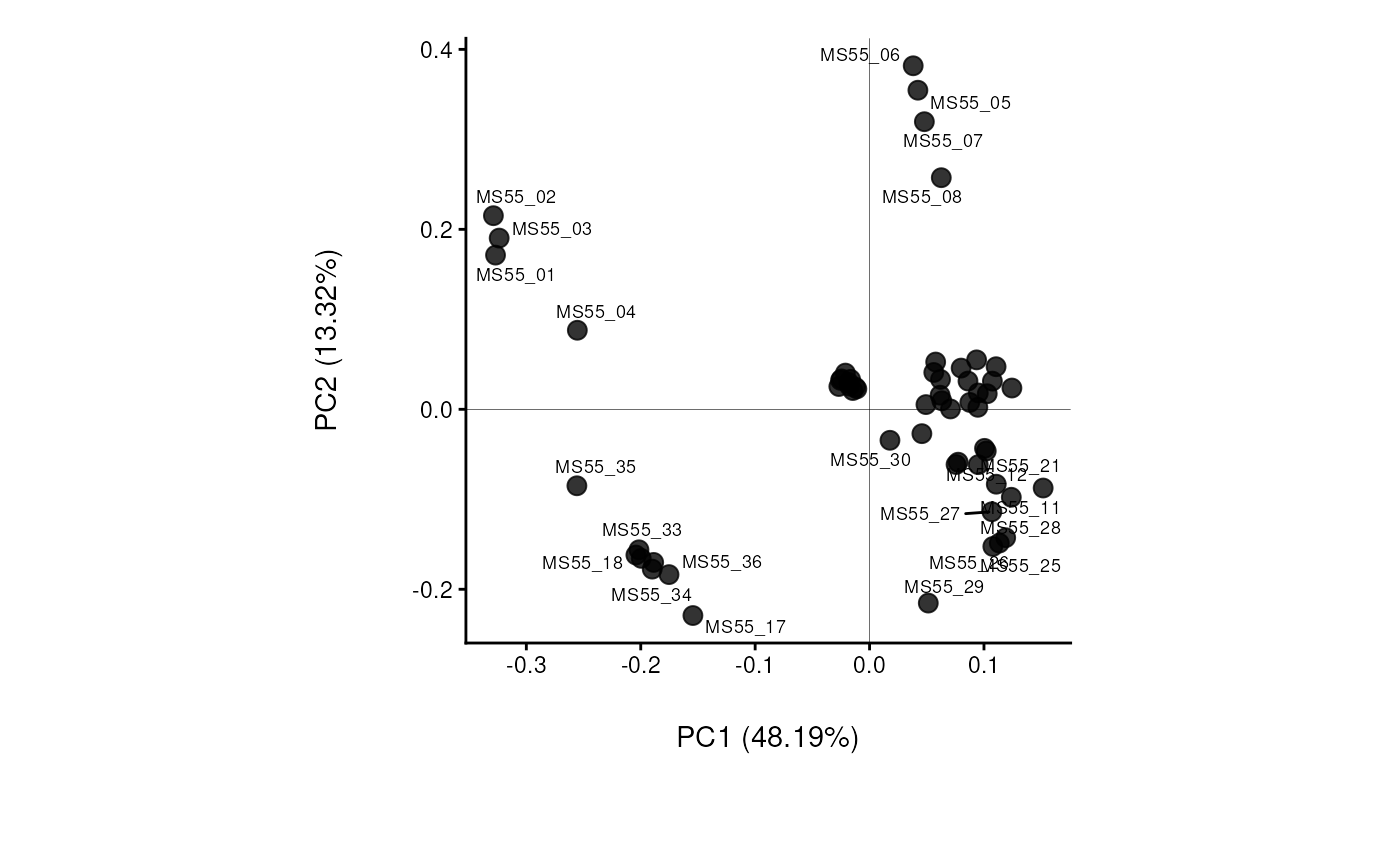
viz_pca.RdPCA plot visualization
Usage
viz_pca(
  data,
  metadata_info = NULL,
  metadata_sample = NULL,
  color_palette = NULL,
  scale_color = "discrete",
  shape_palette = NULL,
  show_loadings = FALSE,
  scaling = TRUE,
  pcx = 1,
  pcy = 2,
  theme = NULL,
  plot_name = "",
  save_plot = "svg",
  print_plot = TRUE,
  path = NULL
)
Arguments
- data
SummarizedExperiment (se) file including assay and colData. If se file is provided, metadata_sample is extracted from the colData of the se object. metadata_feature, if available, are extracted from the rowData. Alternatively provide a DF with unique sample identifiers as row names and metabolite numerical values in columns with metabolite identifiers as column names. Use NA for metabolites that were not detected.
- metadata_info
Optional: NULL or Named vector including at least one of those three information : c(color="ColumnName_Plot_SettingsFile", shape= "ColumnName_Plot_SettingsFile"). Default = NULL
- metadata_sample
Optional: Only required if you did not provide se file in parameter data. Provide DF which contains metadata information about the samples, which will be combined with your input data based on the unique sample identifiers used as rownames. Default = NULL
- color_palette
Optional: Provide customiced color-palette in vector format. For continuous scale use e.g. scale_color_gradient(low = "#88CCEE", high = "red") and for discrete scale c("#88CCEE", "#DDCC77","#661100", "#332288")Default = NULL
- scale_color
Optional: Either "continuous" or "discrete" colour scale. For numeric or integer you can choose either, for character you have to choose discrete. Default = NULL
- shape_palette
Optional: Provide customiced shape-palette in vector format. Default = NULL
- show_loadings
Optional: TRUE or FALSE for whether PCA loadings are also plotted on the PCA (biplot) Default = FALSE
- scaling
Optional: TRUE or FALSE for whether a data scaling is used Default = TRUE
- pcx
Optional: Numeric value of the PC that should be plotted on the x-axis Default = 1
- pcy
Optional: Numeric value of the PC that should be plotted on the y-axis Default = 2
- theme
Optional: Selection of theme for plot, e.g. theme_grey(). You can check for complete themes here: https://ggplot2.tidyverse.org/reference/ggtheme.html. If default=NULL we use theme_classic(). Default = "discrete"
- plot_name
Optional: String which is added to the output files of the PCA Default = ""
- save_plot
Optional: Select the file type of output plots. Options are svg, png, pdf or NULL. Default = svg
- print_plot
Optional: TRUE or FALSE, if TRUE Volcano plot is saved as an overview of the results. Default = TRUE
- path
Optional: Path to the folder the results should be saved at. default: NULL
Examples
data(intracell_raw_se)
Res <- viz_pca(intracell_raw_se)


data(intracell_raw)
Intra <- intracell_raw[, -c(2:4)] %>% tibble::column_to_rownames("Code")
Res <- viz_pca(Intra)
data(intracell_raw)
Intra <- intracell_raw[, -c(2:4)] %>% tibble::column_to_rownames("Code")
Res <- viz_pca(Intra)
