Plotting#
CORNETO supports plotting of graphs through different backends, such as Graphviz, Pydot, and NetworkX
import corneto as cn
import numpy as np

cn.info()

|
|
Using graphviz#
If graphviz and dot are installed, e.g. via conda install python-graphviz, you can use the plot method to visualize the graphs
from corneto.graph import Graph
G = Graph()
G.add_edge(1, 2)
G.add_edge(2, 3)
G.add_edge(1, 3)
G.plot()

# This returns a graphviz object
digraph = G.to_graphviz()
type(digraph)
graphviz.graphs.Digraph
str(digraph)
'digraph {\n\tnode [fixedsize=true]\n\t1 [shape=circle]\n\t2 [shape=circle]\n\t1 -> 2 [arrowhead=normal]\n\t2 [shape=circle]\n\t3 [shape=circle]\n\t2 -> 3 [arrowhead=normal]\n\t1 [shape=circle]\n\t3 [shape=circle]\n\t1 -> 3 [arrowhead=normal]\n}\n'
G.plot_values(edge_values=[-1, 1, 1])

G.plot_values(edge_values=[-1, 1, 1], edge_indexes=[0, 1])

Using Pydot#
from IPython.display import SVG, display

G_pydot = G.to_dot(backend="pydot")
display(SVG(G_pydot.create_svg()))

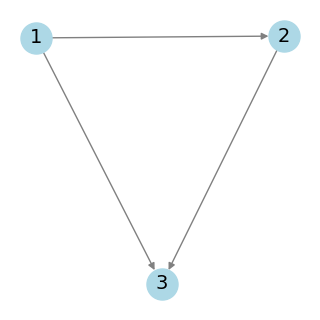
Using NetworkX with Pydot#
import networkx as nx
import matplotlib.pyplot as plt
from networkx.drawing.nx_pydot import from_pydot, graphviz_layout

# Convert pydot to networkx
G_nx = from_pydot(G.to_dot(backend="pydot"))

# Use Graphviz layout (e.g. 'dot' for hierarchies, 'neato' for general layout)
pos = graphviz_layout(G_nx, prog='neato')  # 'neato', 'dot', 'fdp', etc.

# Plot with styling
plt.figure(figsize=(3, 3))
nx.draw(G_nx, pos, with_labels=True, arrows=True,
        node_color='lightblue', edge_color='gray',
        node_size=500, font_size=14)
plt.show()