The heatmap shows the interactions that are present and have importance above
a cutoff value in the to.view but but not in the from.view.
Usage
plot_contrast_heatmap(
  misty.results,
  from.view,
  to.view,
  cutoff = 1,
  trim = -Inf,
  trim.measure = c("gain.R2", "multi.R2", "intra.R2", "gain.RMSE", "multi.RMSE",
    "intra.RMSE")
)
Arguments
- misty.results
a results list generated by
collect_results().- from.view, to.view
abbreviated name of the view.
- cutoff
importance threshold. Importances below this value will be colored white in the heatmap and considered as not relevant.
- trim
display targets with performance value above (if R2 or gain) or below (otherwise) this value only.
- trim.measure
the measure used for trimming.
See also
collect_results() to generate a
results list from raw results.
Other plotting functions:
plot_contrast_results(),
plot_improvement_stats(),
plot_interaction_communities(),
plot_interaction_heatmap(),
plot_view_contributions()
Examples
all.samples <- list.dirs("results", recursive = FALSE)
misty.results <- collect_results(all.samples)
#>
#> Collecting improvements
#>
#> Collecting contributions
#>
#> Collecting importances
#>
#> Aggregating
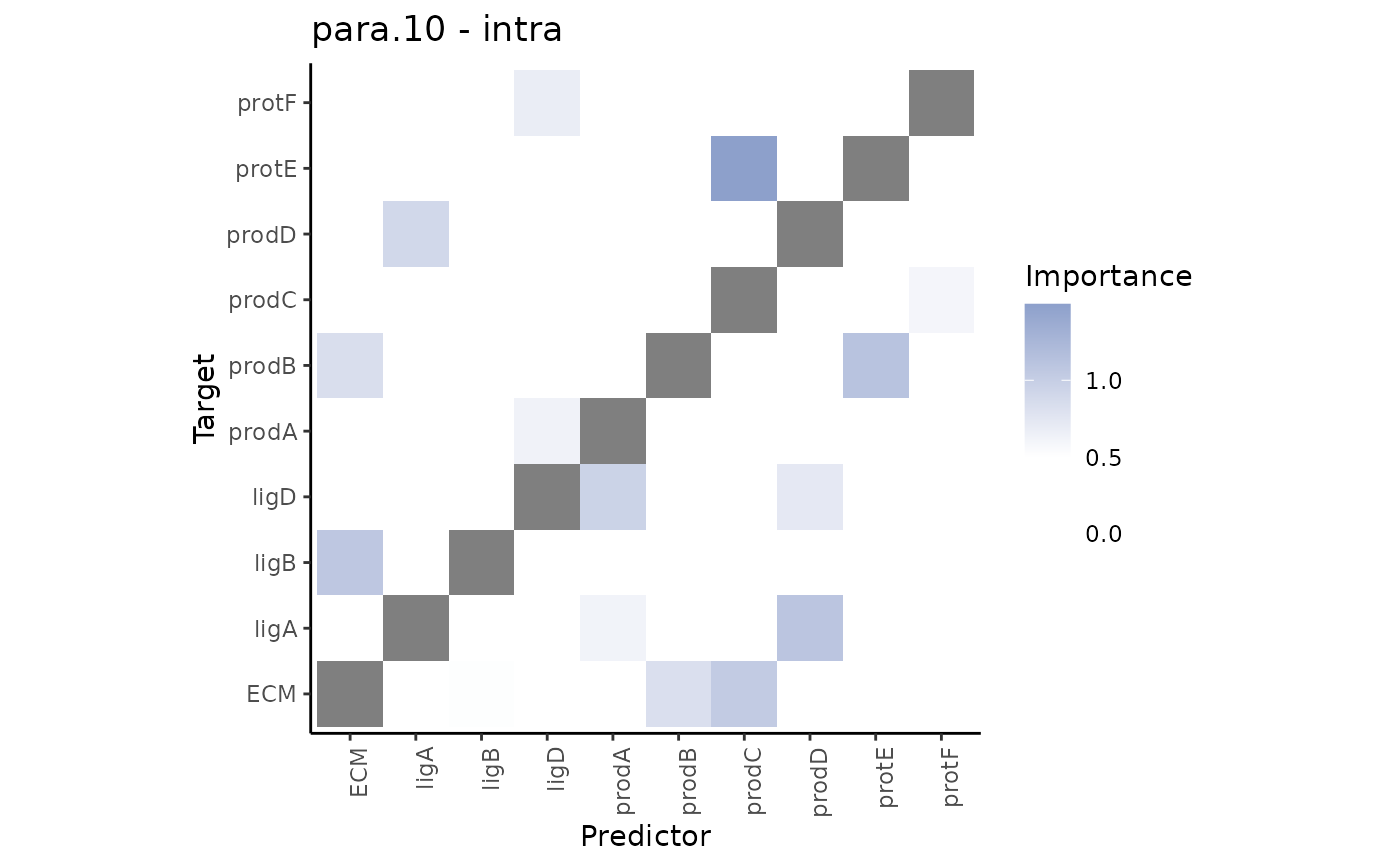
misty.results %>%
plot_contrast_heatmap("intra", "para.10")
#> Warning: Specifying the `id_cols` argument by position was deprecated in tidyr 1.3.0.
#> ℹ Please explicitly name `id_cols`, like `id_cols = -c(view, nsamples)`.
#> ℹ The deprecated feature was likely used in the mistyR package.
#> Please report the issue at <https://github.com/saezlab/mistyR/issues>.
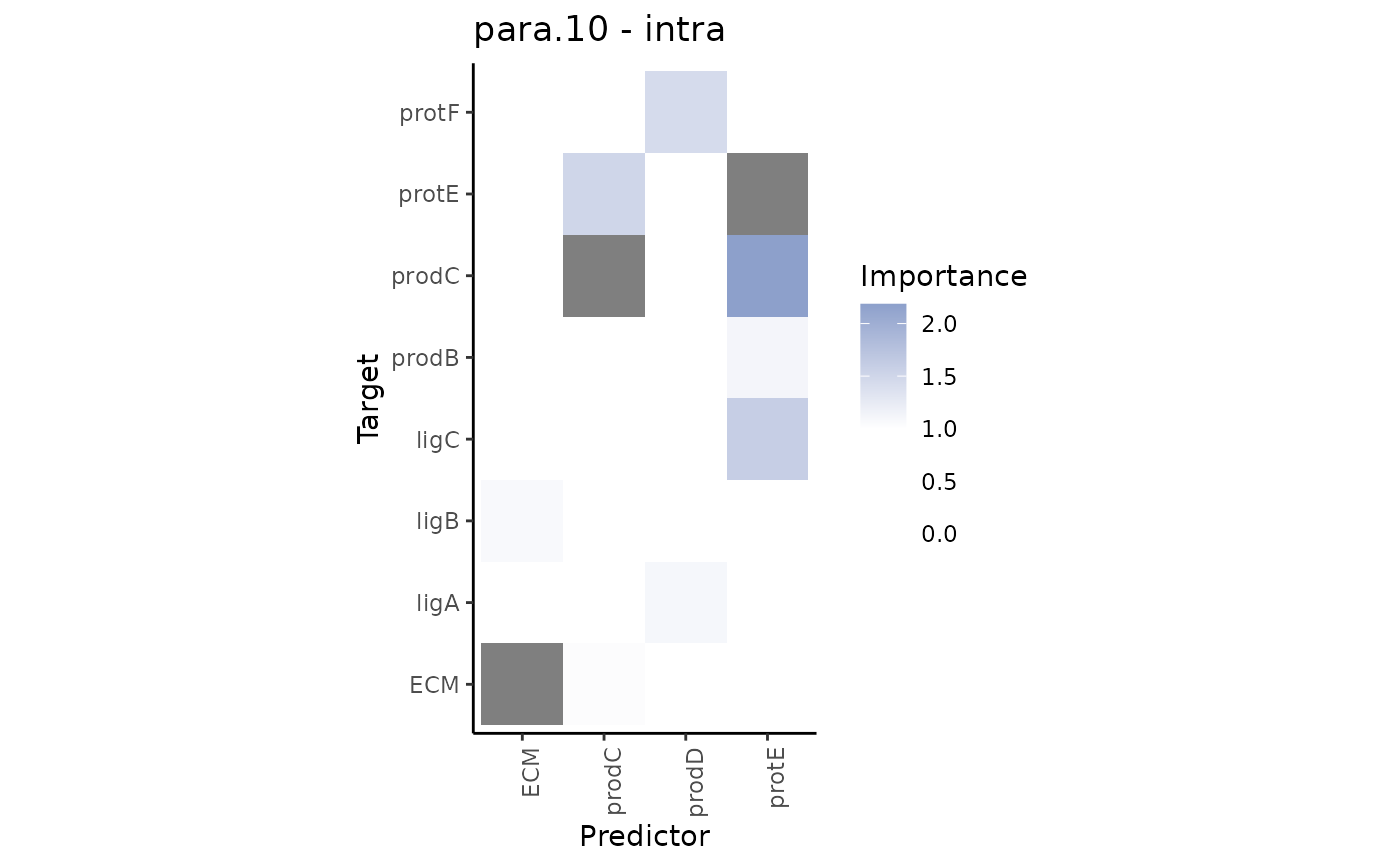 misty.results %>%
plot_contrast_heatmap("intra", "para.10", cutoff = 0.5)
misty.results %>%
plot_contrast_heatmap("intra", "para.10", cutoff = 0.5)