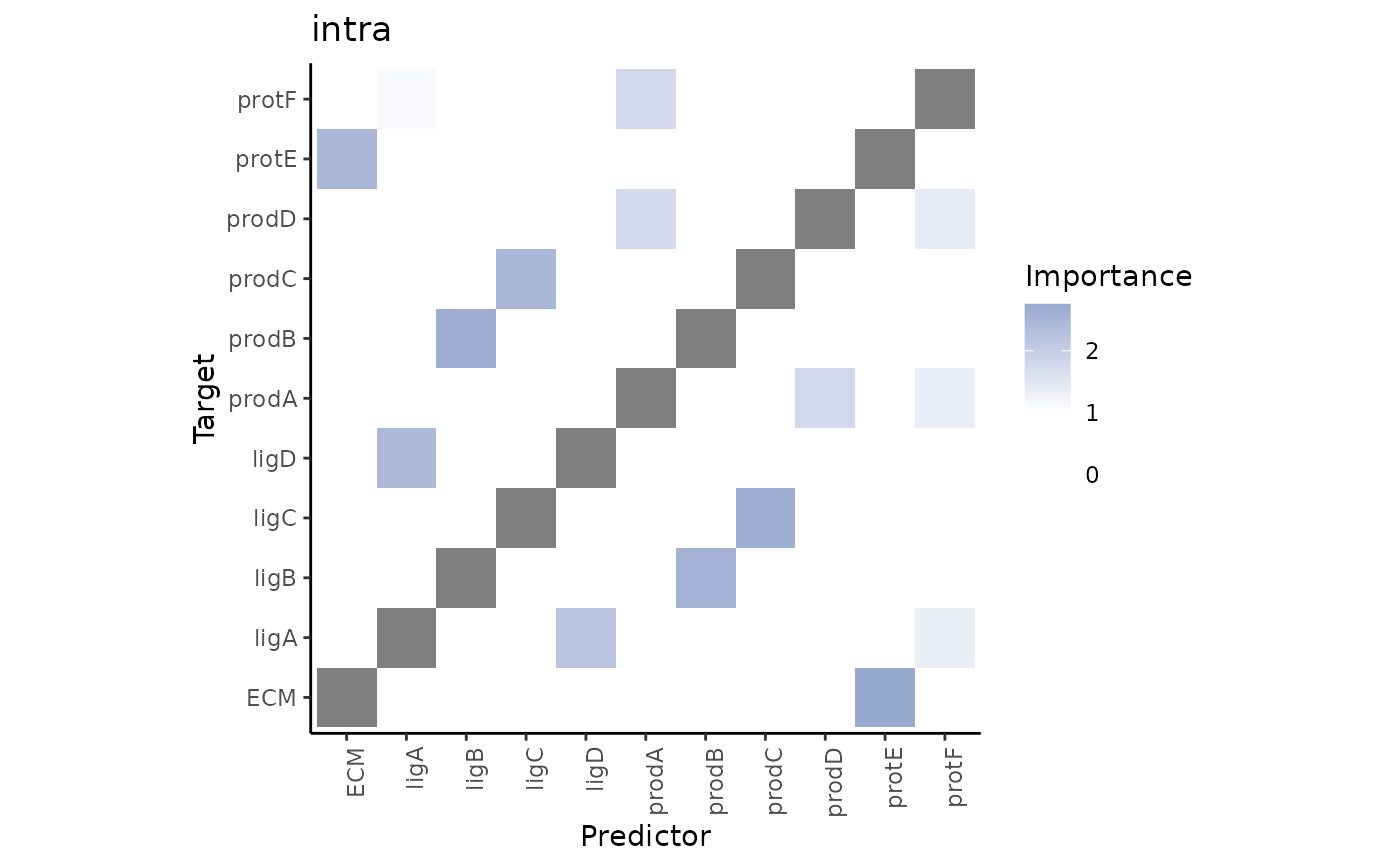
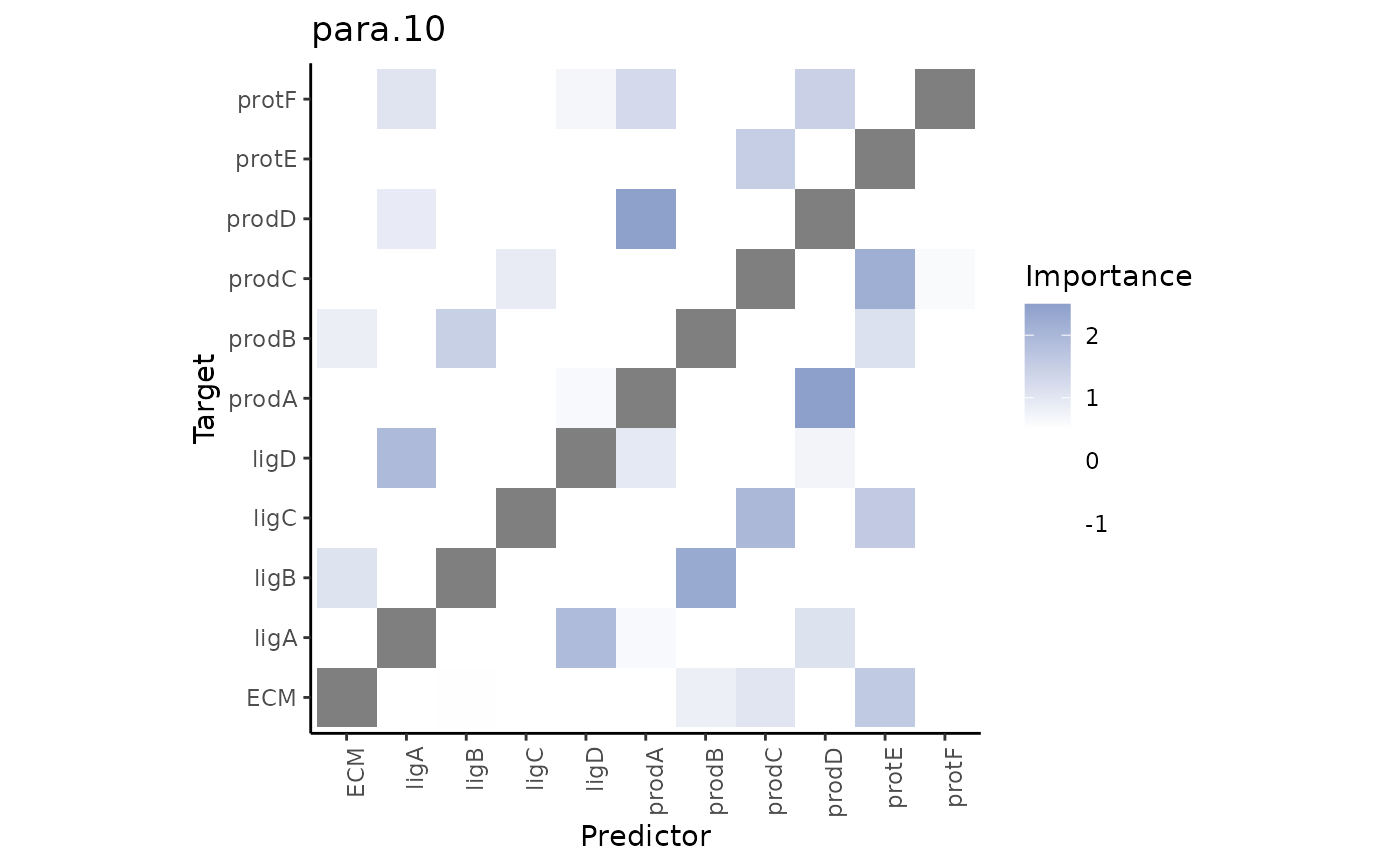
Generate a heatmap with importances of predictor-target interaction.
Usage
plot_interaction_heatmap(
  misty.results,
  view,
  cutoff = 1,
  trim = -Inf,
  trim.measure = c("gain.R2", "multi.R2", "intra.R2", "gain.RMSE", "multi.RMSE",
    "intra.RMSE"),
  clean = FALSE
)
Arguments
- misty.results
a results list generated by
collect_results().- view
abbreviated name of the view.
- cutoff
importance threshold. Importances below this value will be colored white in the heatmap and considered as not relevant.
- trim
display targets with performance value above (if R2 or gain) or below (otherwise) this value only.
- trim.measure
the measure used for trimming.
- clean
a
logicalindicating whether to remove rows and columns with all importances are belowcutofffrom the heatmap.
See also
collect_results() to generate
a results list from raw results.
Other plotting functions:
plot_contrast_heatmap(),
plot_contrast_results(),
plot_improvement_stats(),
plot_interaction_communities(),
plot_view_contributions()
Examples
all.samples <- list.dirs("results", recursive = FALSE)

collect_results(all.samples) %>%
  plot_interaction_heatmap("intra") %>%
  plot_interaction_heatmap("para.10", cutoff = 0.5)
#>
#> Collecting improvements
#>
#> Collecting contributions
#>
#> Collecting importances
#>
#> Aggregating