Identify and plot a graph of marker interaction communities.
Arguments
- misty.results
a results list generated by
collect_results().- view
abbreviated name of the view.
- cutoff
importance threshold. Importances below this value will be colored white in the heatmap and considered as not relevant.
Details
The communities are identified using the Louvain algorithm. Communities can be extracted only from views that have the same predictor and target markers.
See also
collect_results() to generate a
results list from raw results.
Other plotting functions:
plot_contrast_heatmap(),
plot_contrast_results(),
plot_improvement_stats(),
plot_interaction_heatmap(),
plot_view_contributions()
Examples
all.samples <- list.dirs("results", recursive = FALSE)
misty.results <- collect_results(all.samples)
#>
#> Collecting improvements
#>
#> Collecting contributions
#>
#> Collecting importances
#>
#> Aggregating
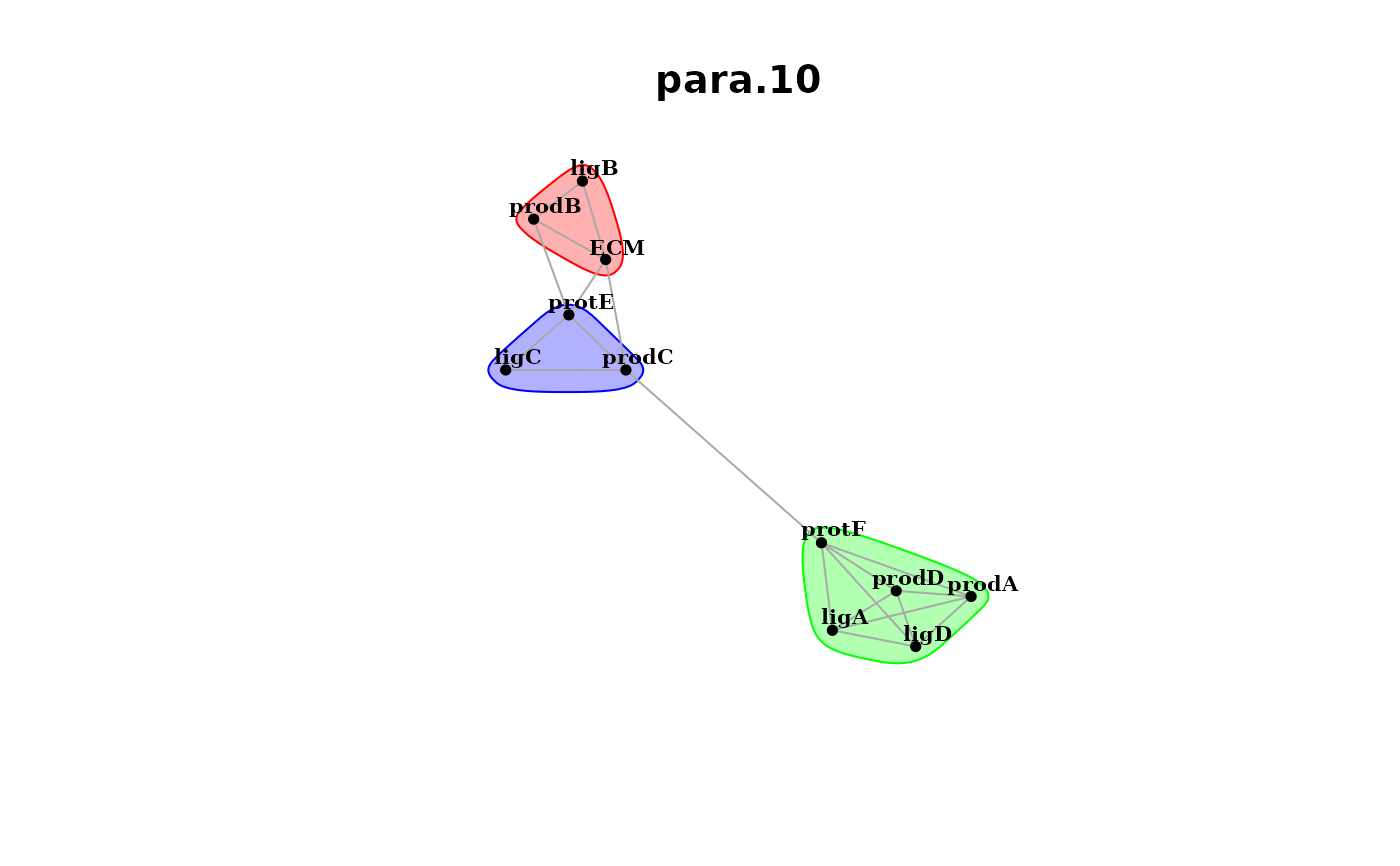
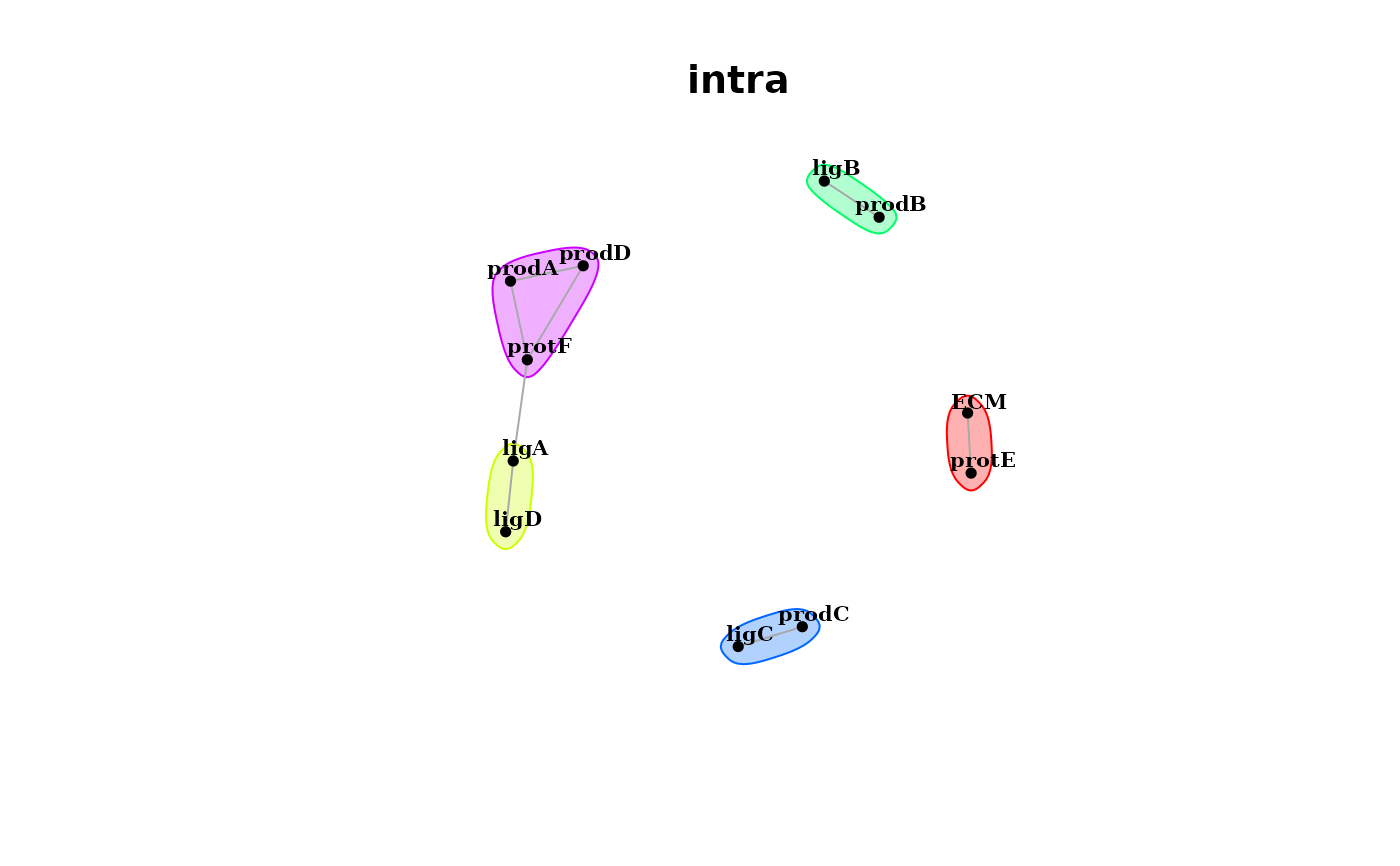
misty.results %>%
plot_interaction_communities("intra") %>%
plot_interaction_communities("para.10")
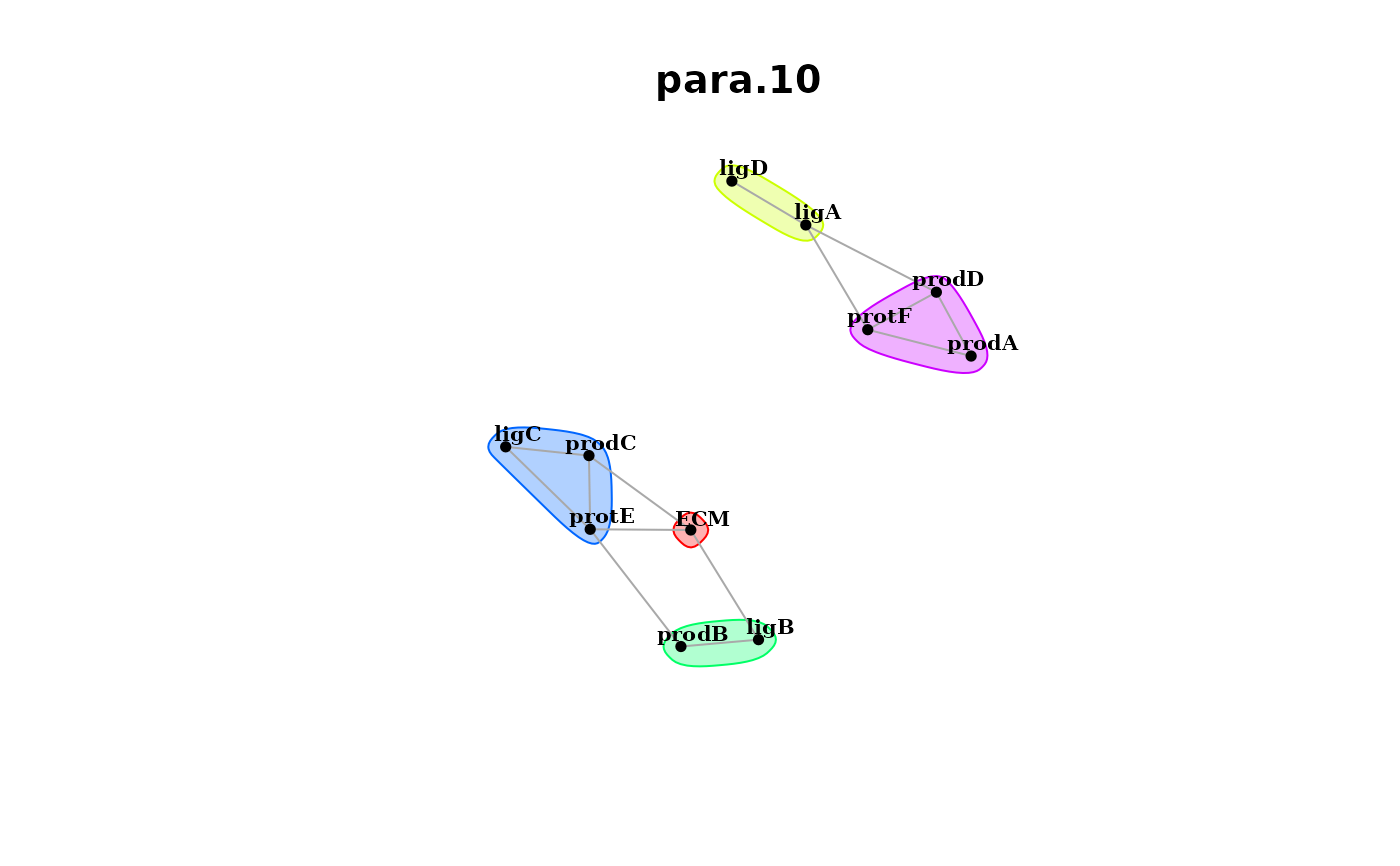 misty.results %>%
plot_interaction_communities("para.10", cutoff = 0.5)
misty.results %>%
plot_interaction_communities("para.10", cutoff = 0.5)