Metabolite clustering analysis for two conditions
Source:R/MetaboliteClusteringAnalysis.R
mca_2cond.RdPerforms metabolite clustering analysis and computes clusters based on regulatory rules between conditions.
Usage
mca_2cond(
  data_c1,
  data_c2,
  metadata_info_c1 = c(ValueCol = "Log2FC", StatCol = "p.adj", cutoff_stat = 0.05,
    ValueCutoff = 1),
  metadata_info_c2 = c(ValueCol = "Log2FC", StatCol = "p.adj", cutoff_stat = 0.05,
    ValueCutoff = 1),
  feature = "Metabolite",
  save_table = "csv",
  method_background = "C1&C2",
  path = NULL
)
Arguments
- data_c1
DF for your data (results from e.g. dma) containing metabolites in rows with corresponding Log2FC and stat (p-value, p.adjusted) value columns.
- data_c2
DF for your data (results from e.g. dma) containing metabolites in rows with corresponding Log2FC and stat (p-value, p.adjusted) value columns.
- metadata_info_c1
Optional: Pass ColumnNames and Cutoffs for condition 1 including the value column (e.g. Log2FC, Log2Diff, t.val, etc) and the stats column (e.g. p.adj, p.val). This must include: c(ValueCol=ColumnName_data_c1,StatCol=ColumnName_data_c1, cutoff_stat= NumericValue, ValueCutoff=NumericValue) Default=c(ValueCol="Log2FC",StatCol="p.adj", cutoff_stat= 0.05, ValueCutoff=1)
- metadata_info_c2
Optional: Pass ColumnNames and Cutoffs for condition 2 includingthe value column (e.g. Log2FC, Log2Diff, t.val, etc) and the stats column (e.g. p.adj, p.val). This must include: c(ValueCol=ColumnName_data_c2,StatCol=ColumnName_data_c2, cutoff_stat= NumericValue, ValueCutoff=NumericValue)Default=c(ValueCol="Log2FC",StatCol="p.adj", cutoff_stat= 0.05, ValueCutoff=1)
- feature
Optional: Column name of Column including the Metabolite identifiers. This MUST BE THE SAME in each of your Input files. Default="Metabolite"
- save_table
Optional: File types for the analysis results are: "csv", "xlsx", "txt" Default = "csv"
- method_background
Optional: Background method C1|C2, C1&C2, C2, C1 or * Default="C1&C2"
- path
Optional: Path to the folder the results should be saved at. Default = NULL
Value
List of two DFs: 1. summary of the cluster count and 2. the detailed information of each metabolites in the clusters.
Examples
data(intracell_raw)
Intra <- intracell_raw %>% tibble::column_to_rownames("Code")
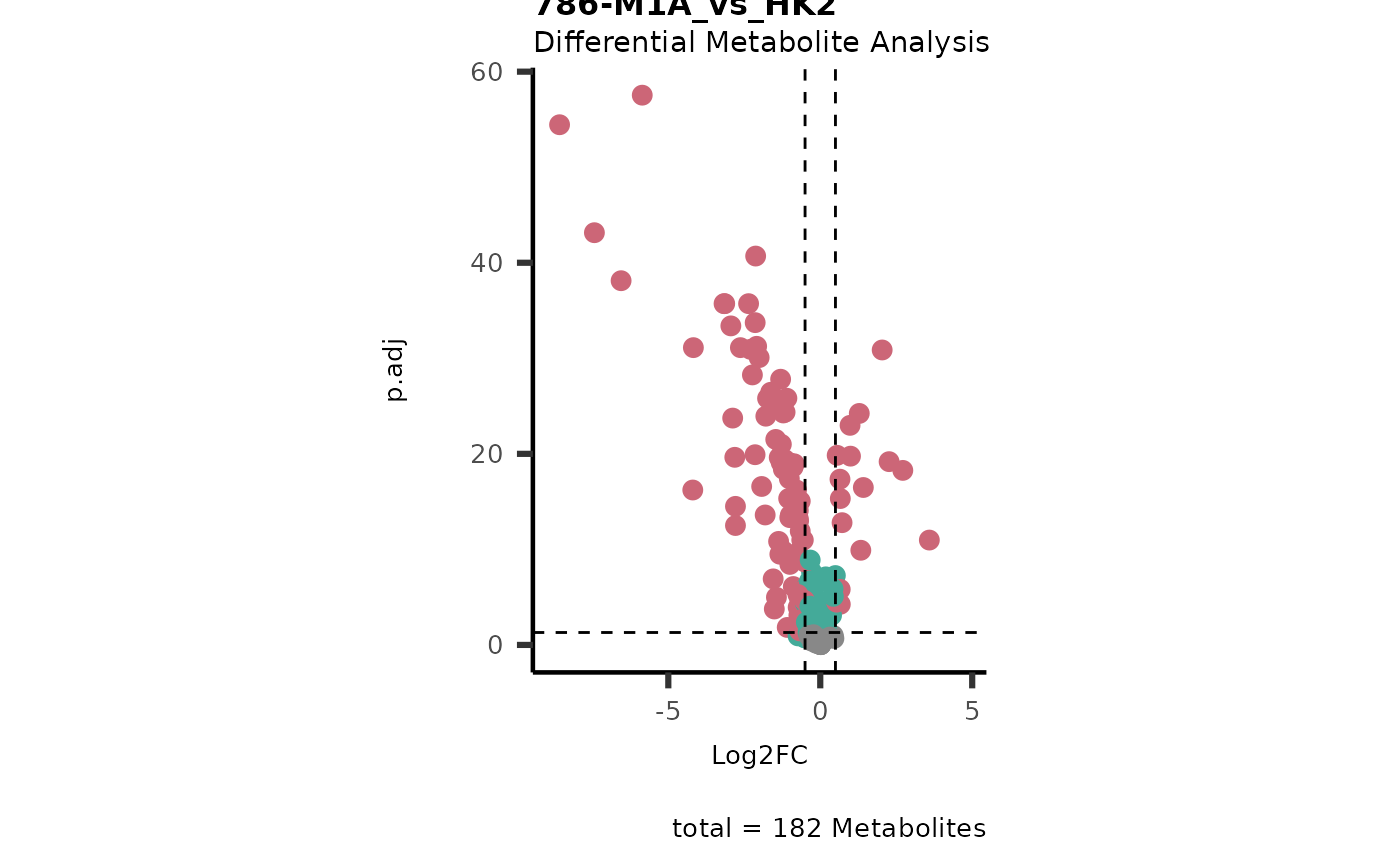
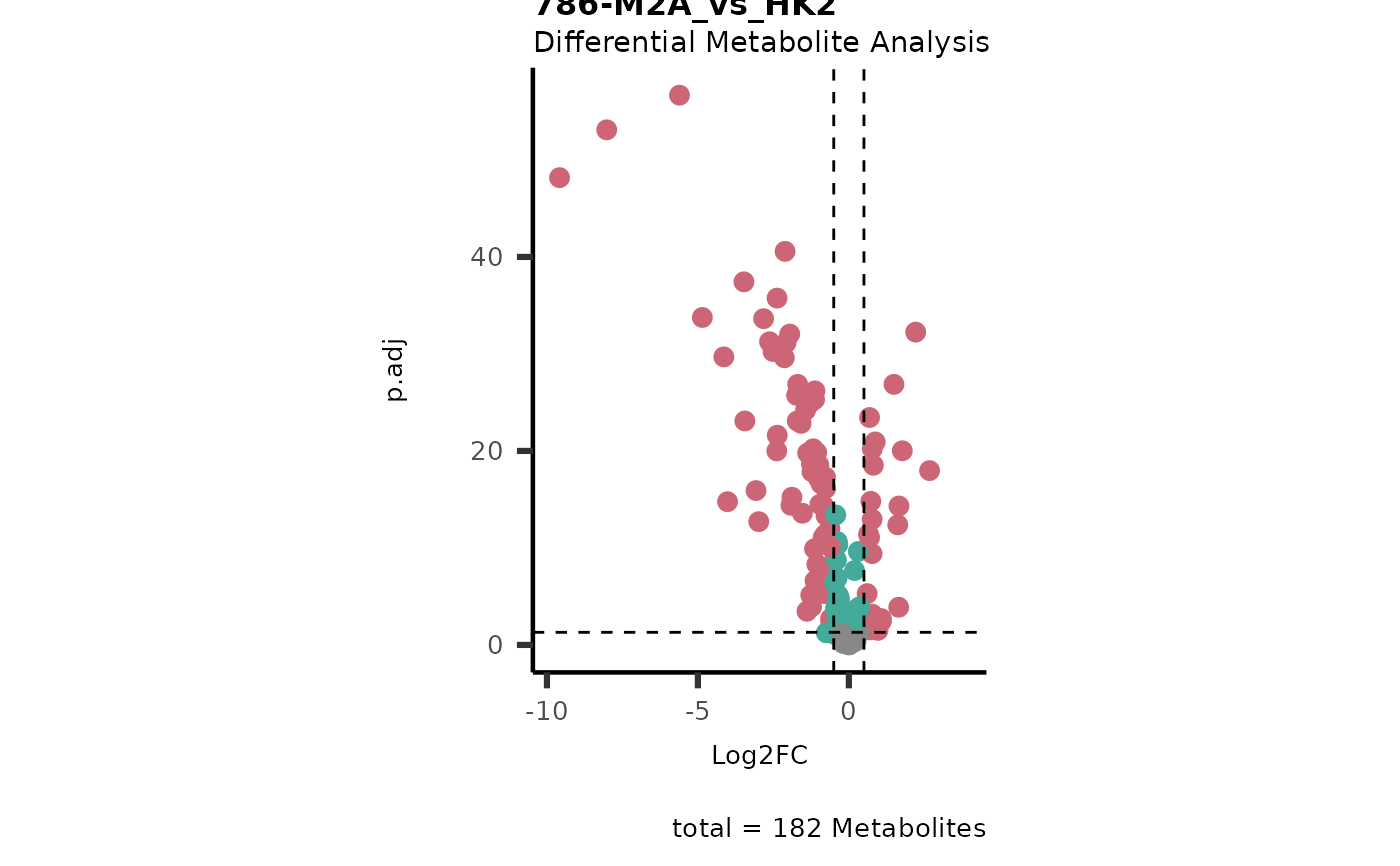
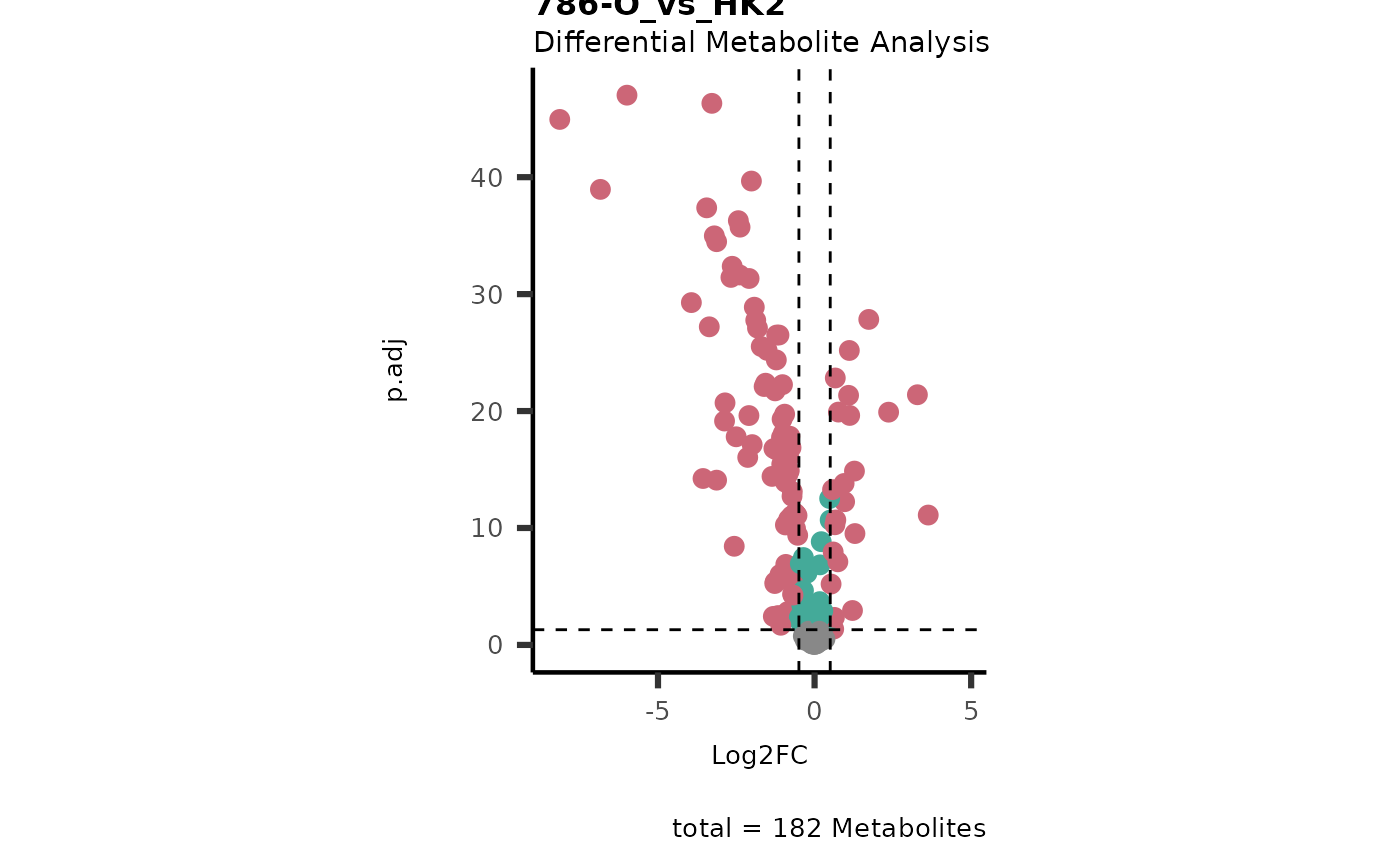
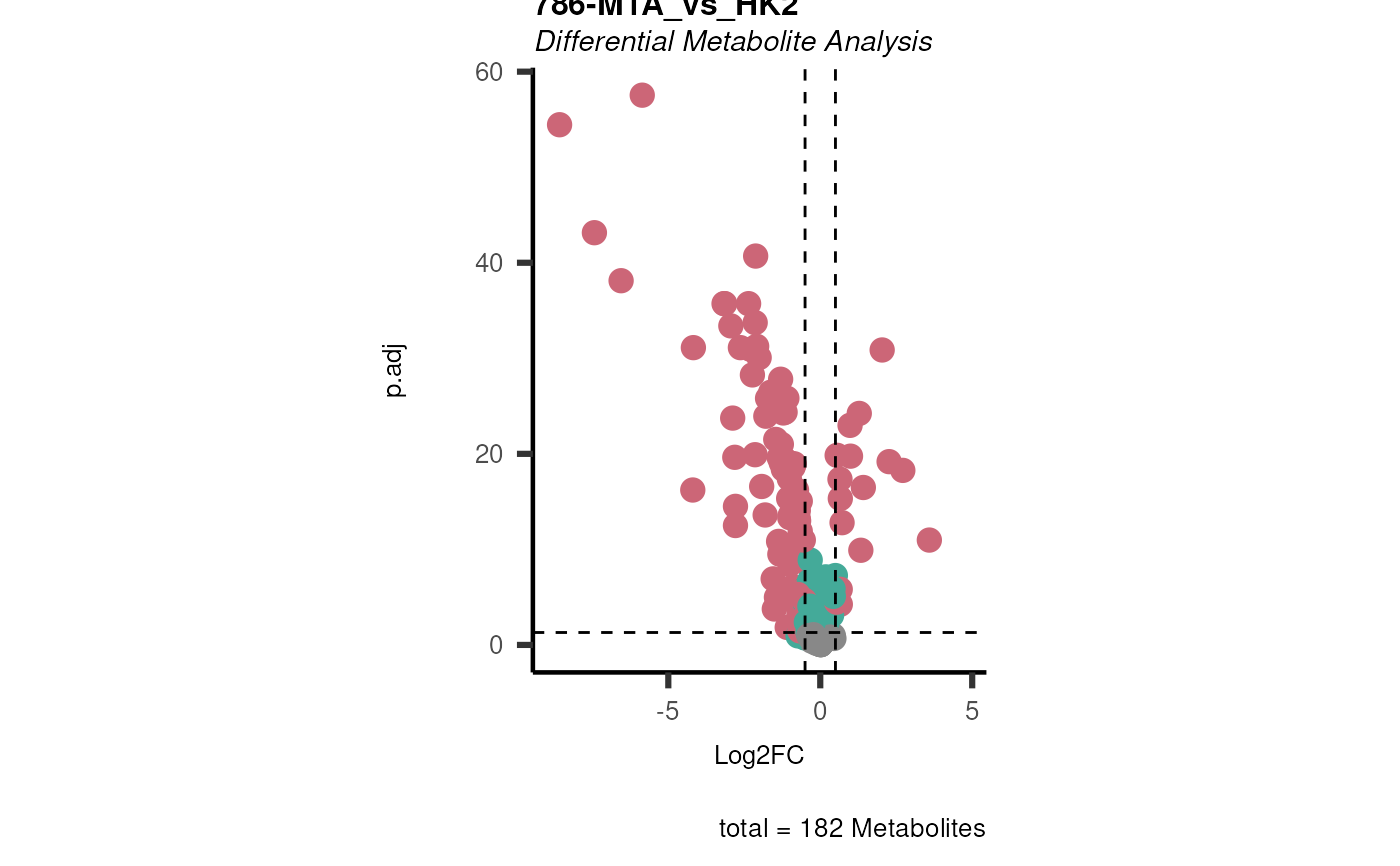
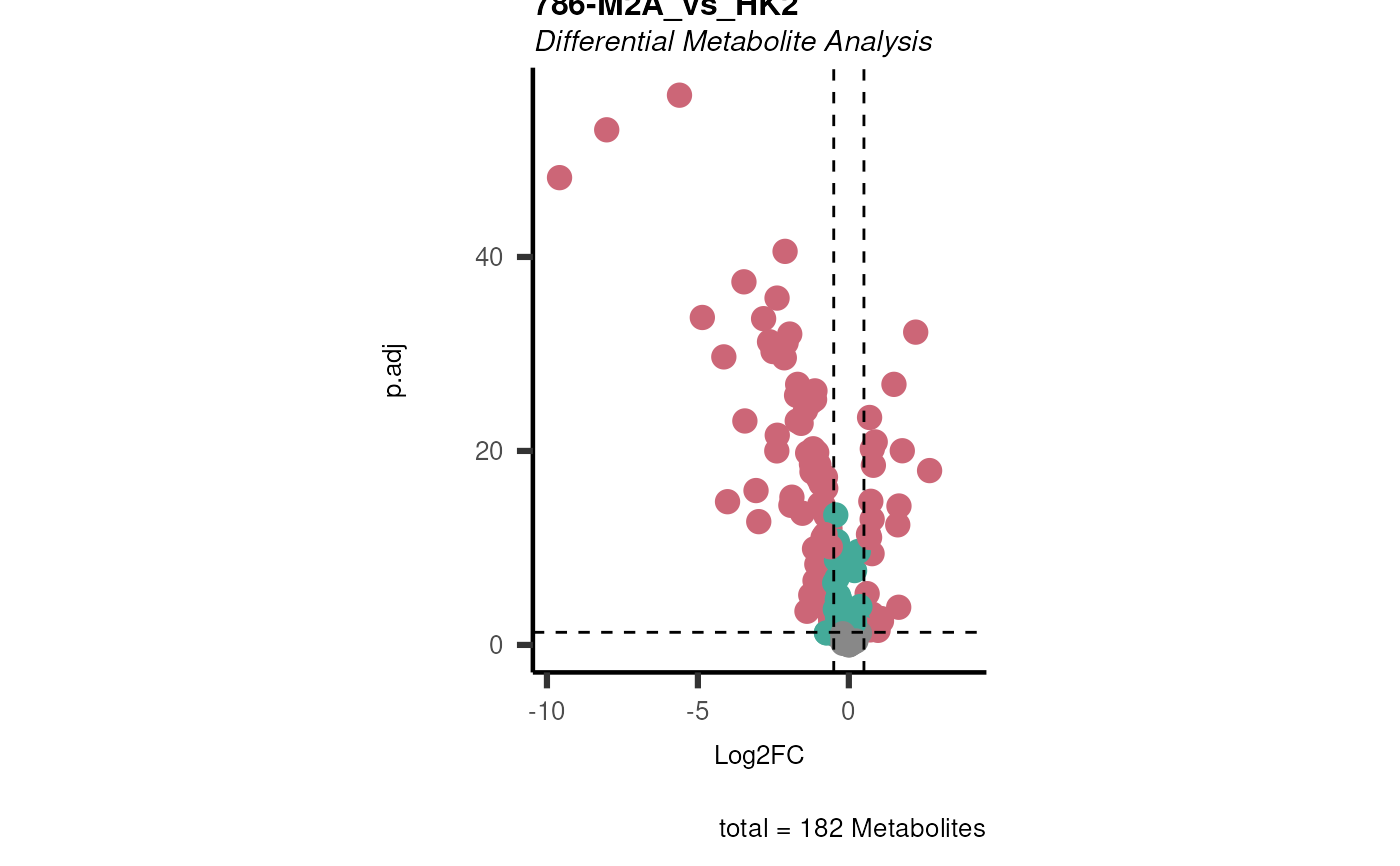
Input <- dma(
data = Intra[-c(49:58), -c(1:3)],
metadata_sample = Intra[-c(49:58), c(1:3)],
metadata_info = c(
Conditions = "Conditions",
Numerator = NULL,
Denominator = "HK2"
)
)
#> In `Numerator` 786-O, 786-M1A, 786-M2A, NA/0 values exist in 5 Metabolite(s). and in `denominator`HK2 2 Metabolite(s
#> ).. Those metabolite(s) might return p.val = NA, p.adj.= NA, t.val = NA. The Log2FC = Inf, if all replicates are 0/NA.
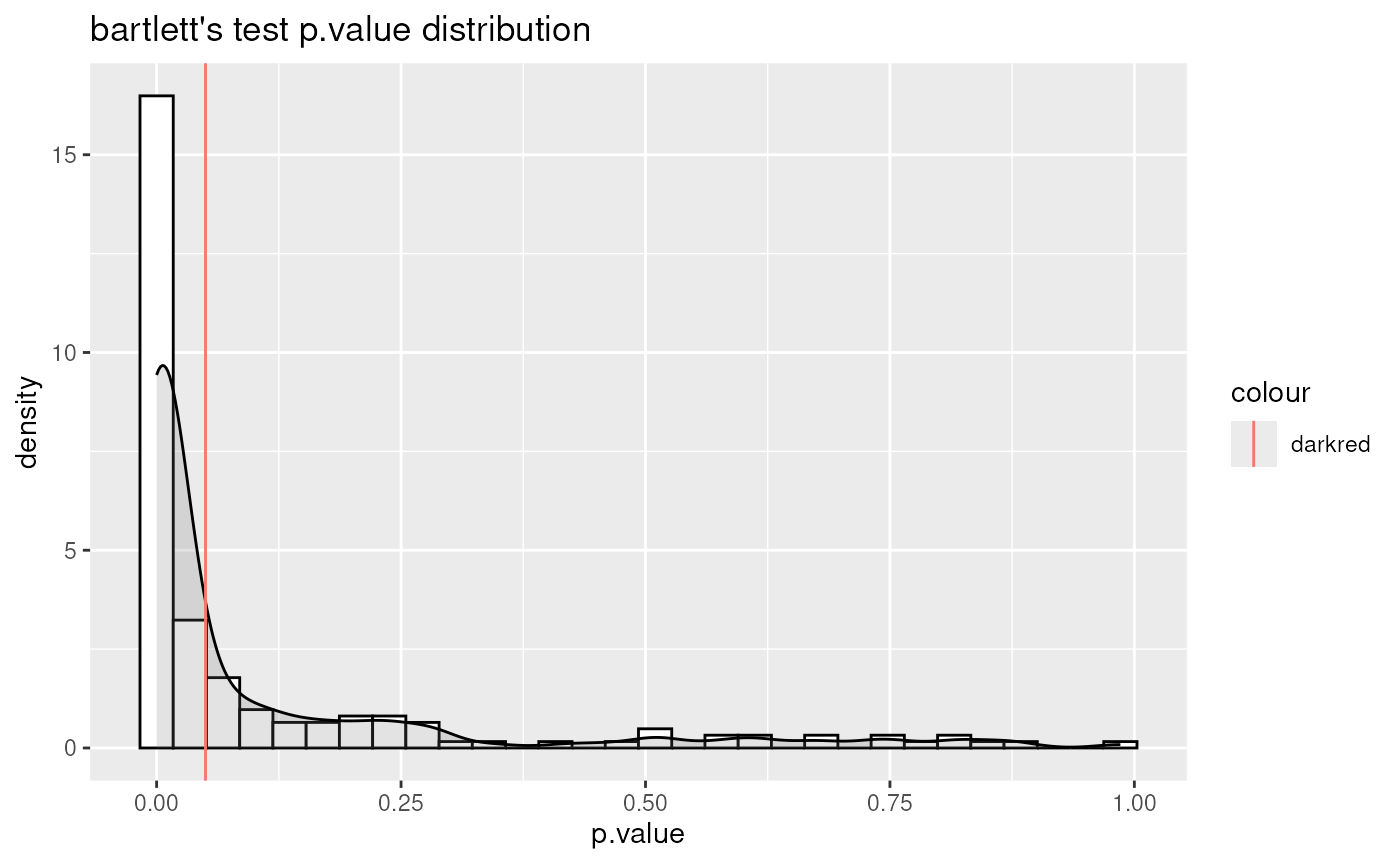
#> Warning: There are NA's / 0s in the data. This can impact the output of the SHapiro-Wilk test for all metabolites that include NAs / 0s.
#> Warning: Computation failed in `stat_bin()`.
#> Caused by error in `bin_breaks_width()`:
#> ! The number of histogram bins must be less than 1,000,000.
#> ℹ Did you make `binwidth` too small?
#> Warning: Removed 556 rows containing non-finite outside the scale range (`stat_bin()`).
#> Warning: Computation failed in `stat_bin()`.
#> Caused by error in `bin_breaks_width()`:
#> ! The number of histogram bins must be less than 1,000,000.
#> ℹ Did you make `binwidth` too small?
#> Warning: Removed 556 rows containing non-finite outside the scale range
#> (`stat_density()`).
#> Warning: Computation failed in `stat_bin()`.
#> Caused by error in `bin_breaks_width()`:
#> ! The number of histogram bins must be less than 1,000,000.
#> ℹ Did you make `binwidth` too small?
#> Warning: Removed 461 rows containing non-finite outside the scale range (`stat_bin()`).
#> Warning: Computation failed in `stat_bin()`.
#> Caused by error in `bin_breaks_width()`:
#> ! The number of histogram bins must be less than 1,000,000.
#> ℹ Did you make `binwidth` too small?
#> Warning: Removed 461 rows containing non-finite outside the scale range
#> (`stat_density()`).
#> Warning: Computation failed in `stat_bin()`.
#> Caused by error in `bin_breaks_width()`:
#> ! The number of histogram bins must be less than 1,000,000.
#> ℹ Did you make `binwidth` too small?
#> Warning: Removed 458 rows containing non-finite outside the scale range (`stat_bin()`).
#> Warning: Computation failed in `stat_bin()`.
#> Caused by error in `bin_breaks_width()`:
#> ! The number of histogram bins must be less than 1,000,000.
#> ℹ Did you make `binwidth` too small?
#> Warning: Removed 458 rows containing non-finite outside the scale range
#> (`stat_density()`).
#> Warning: Computation failed in `stat_bin()`.
#> Caused by error in `bin_breaks_width()`:
#> ! The number of histogram bins must be less than 1,000,000.
#> ℹ Did you make `binwidth` too small?
#> Warning: Removed 614 rows containing non-finite outside the scale range (`stat_bin()`).
#> Warning: Computation failed in `stat_bin()`.
#> Caused by error in `bin_breaks_width()`:
#> ! The number of histogram bins must be less than 1,000,000.
#> ℹ Did you make `binwidth` too small?
#> Warning: Removed 614 rows containing non-finite outside the scale range
#> (`stat_density()`).
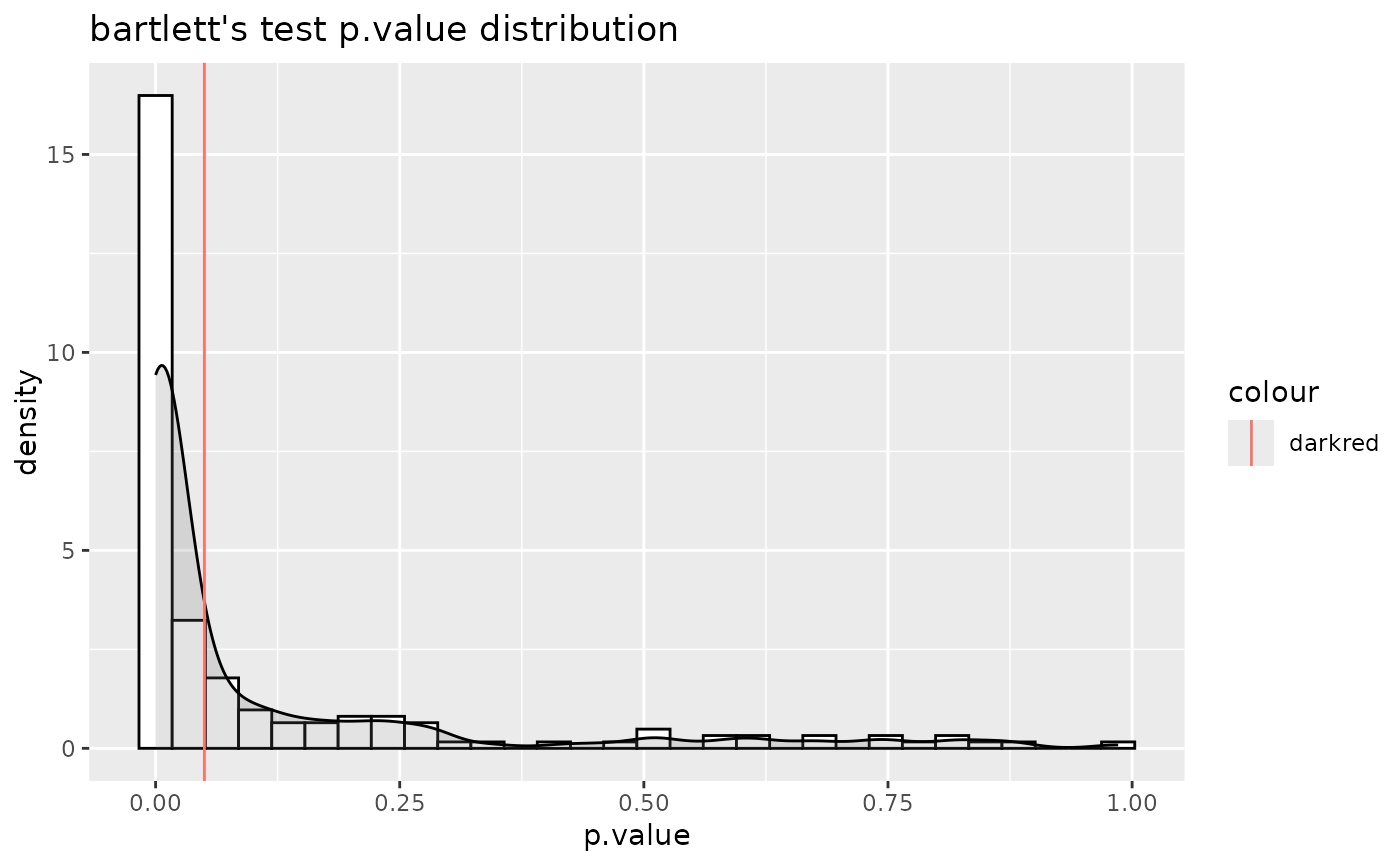
#> For 32.97% of metabolites the group variances are equal.
#> Warning: Partial NA coefficients for 1 probe(s)
#> Warning: Removed 556 rows containing non-finite outside the scale range (`stat_bin()`).
#> Warning: Computation failed in `stat_bin()`.
#> Caused by error in `bin_breaks_width()`:
#> ! The number of histogram bins must be less than 1,000,000.
#> ℹ Did you make `binwidth` too small?
#> Warning: Removed 556 rows containing non-finite outside the scale range
#> (`stat_density()`).
#> Warning: Removed 461 rows containing non-finite outside the scale range (`stat_bin()`).
#> Warning: Computation failed in `stat_bin()`.
#> Caused by error in `bin_breaks_width()`:
#> ! The number of histogram bins must be less than 1,000,000.
#> ℹ Did you make `binwidth` too small?
#> Warning: Removed 461 rows containing non-finite outside the scale range
#> (`stat_density()`).
 #> Warning: Removed 461 rows containing non-finite outside the scale range (`stat_bin()`).
#> Warning: Computation failed in `stat_bin()`.
#> Caused by error in `bin_breaks_width()`:
#> ! The number of histogram bins must be less than 1,000,000.
#> ℹ Did you make `binwidth` too small?
#> Warning: Removed 461 rows containing non-finite outside the scale range
#> (`stat_density()`).
#> Warning: Removed 458 rows containing non-finite outside the scale range (`stat_bin()`).
#> Warning: Computation failed in `stat_bin()`.
#> Caused by error in `bin_breaks_width()`:
#> ! The number of histogram bins must be less than 1,000,000.
#> ℹ Did you make `binwidth` too small?
#> Warning: Removed 458 rows containing non-finite outside the scale range
#> (`stat_density()`).
#> Warning: Removed 461 rows containing non-finite outside the scale range (`stat_bin()`).
#> Warning: Computation failed in `stat_bin()`.
#> Caused by error in `bin_breaks_width()`:
#> ! The number of histogram bins must be less than 1,000,000.
#> ℹ Did you make `binwidth` too small?
#> Warning: Removed 461 rows containing non-finite outside the scale range
#> (`stat_density()`).
#> Warning: Removed 458 rows containing non-finite outside the scale range (`stat_bin()`).
#> Warning: Computation failed in `stat_bin()`.
#> Caused by error in `bin_breaks_width()`:
#> ! The number of histogram bins must be less than 1,000,000.
#> ℹ Did you make `binwidth` too small?
#> Warning: Removed 458 rows containing non-finite outside the scale range
#> (`stat_density()`).
 #> Warning: Removed 458 rows containing non-finite outside the scale range (`stat_bin()`).
#> Warning: Computation failed in `stat_bin()`.
#> Caused by error in `bin_breaks_width()`:
#> ! The number of histogram bins must be less than 1,000,000.
#> ℹ Did you make `binwidth` too small?
#> Warning: Removed 458 rows containing non-finite outside the scale range
#> (`stat_density()`).
#> Warning: Removed 614 rows containing non-finite outside the scale range (`stat_bin()`).
#> Warning: Computation failed in `stat_bin()`.
#> Caused by error in `bin_breaks_width()`:
#> ! The number of histogram bins must be less than 1,000,000.
#> ℹ Did you make `binwidth` too small?
#> Warning: Removed 614 rows containing non-finite outside the scale range
#> (`stat_density()`).
#> Warning: Removed 458 rows containing non-finite outside the scale range (`stat_bin()`).
#> Warning: Computation failed in `stat_bin()`.
#> Caused by error in `bin_breaks_width()`:
#> ! The number of histogram bins must be less than 1,000,000.
#> ℹ Did you make `binwidth` too small?
#> Warning: Removed 458 rows containing non-finite outside the scale range
#> (`stat_density()`).
#> Warning: Removed 614 rows containing non-finite outside the scale range (`stat_bin()`).
#> Warning: Computation failed in `stat_bin()`.
#> Caused by error in `bin_breaks_width()`:
#> ! The number of histogram bins must be less than 1,000,000.
#> ℹ Did you make `binwidth` too small?
#> Warning: Removed 614 rows containing non-finite outside the scale range
#> (`stat_density()`).
 #> Warning: Removed 614 rows containing non-finite outside the scale range (`stat_bin()`).
#> Warning: Computation failed in `stat_bin()`.
#> Caused by error in `bin_breaks_width()`:
#> ! The number of histogram bins must be less than 1,000,000.
#> ℹ Did you make `binwidth` too small?
#> Warning: Removed 614 rows containing non-finite outside the scale range
#> (`stat_density()`).
#> `stat_bin()` using `bins = 30`. Pick better value `binwidth`.
#> Warning: Removed 614 rows containing non-finite outside the scale range (`stat_bin()`).
#> Warning: Computation failed in `stat_bin()`.
#> Caused by error in `bin_breaks_width()`:
#> ! The number of histogram bins must be less than 1,000,000.
#> ℹ Did you make `binwidth` too small?
#> Warning: Removed 614 rows containing non-finite outside the scale range
#> (`stat_density()`).
#> `stat_bin()` using `bins = 30`. Pick better value `binwidth`.
 #> `stat_bin()` using `bins = 30`. Pick better value `binwidth`.
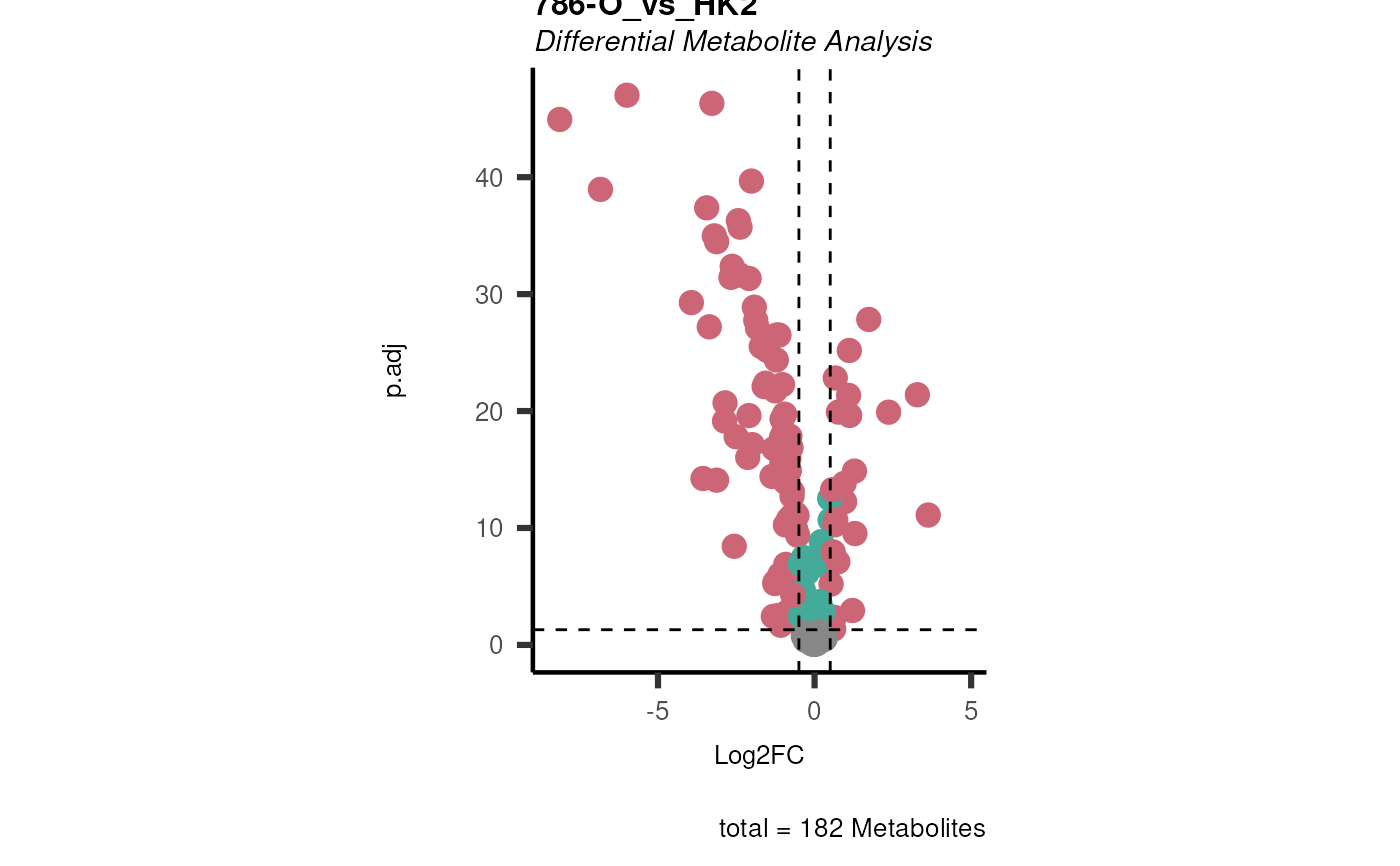 Res <- mca_2cond(
data_c1 = Input[["dma"]][["786-O_vs_HK2"]],
data_c2 = Input[["dma"]][["786-M1A_vs_HK2"]]
)
#> Warning: data_c1 includes NAs in Log2FC and/or in p.adj. 1 metabolites containing NAs are removed.
#> Warning: data_c2 includes NAs in Log2FC and/or inp.adj. 1 metabolites containing NAs are removed.
Res <- mca_2cond(
data_c1 = Input[["dma"]][["786-O_vs_HK2"]],
data_c2 = Input[["dma"]][["786-M1A_vs_HK2"]]
)
#> Warning: data_c1 includes NAs in Log2FC and/or in p.adj. 1 metabolites containing NAs are removed.
#> Warning: data_c2 includes NAs in Log2FC and/or inp.adj. 1 metabolites containing NAs are removed.