Metabolite clustering analysis for core experiments
Source:R/MetaboliteClusteringAnalysis.R
mca_core.RdPerforms metabolite clustering analysis and computes clusters based on regulatory rules between intracellular and culture media metabolomics in core experiments.
Usage
mca_core(
  data_intra,
  data_core,
  metadata_info_intra = c(ValueCol = "Log2FC", StatCol = "p.adj", cutoff_stat = 0.05,
    ValueCutoff = 1),
  metadata_info_core = c(DirectionCol = "core", ValueCol = "Log2(Distance)", StatCol =
    "p.adj", cutoff_stat = 0.05, ValueCutoff = 1),
  feature = "Metabolite",
  save_table = "csv",
  method_background = "Intra&core",
  path = NULL
)
Arguments
- data_intra
DF for your data (results from e.g. dma) containing metabolites in rows with corresponding Log2FC and stat (p-value, p.adjusted) value columns.
- data_core
DF for your data (results from e.g. dma) containing metabolites in rows with corresponding Log2FC and stat (p-value, p.adjusted) value columns. Here we additionally require
- metadata_info_intra
Optional: Pass ColumnNames and Cutoffs for the intracellular metabolomics including the value column (e.g. Log2FC, Log2Diff, t.val, etc) and the stats column (e.g. p.adj, p.val). This must include: c(ValueCol=ColumnName_data_intra,StatCol=ColumnName_data_intra, cutoff_stat= NumericValue, ValueCutoff=NumericValue) Default=c(ValueCol="Log2FC",StatCol="p.adj", cutoff_stat= 0.05, ValueCutoff=1)
- metadata_info_core
Optional: Pass ColumnNames and Cutoffs for the consumption-release metabolomics including the direction column, the value column (e.g. Log2Diff, t.val, etc) and the stats column (e.g. p.adj, p.val). This must include: c(DirectionCol= ColumnName_data_core,ValueCol=ColumnName_data_core,StatCol=ColumnName_data_core, cutoff_stat= NumericValue, ValueCutoff=NumericValue)Default=c(DirectionCol="core", ValueCol="Log2(Distance)",StatCol="p.adj", cutoff_stat= 0.05, ValueCutoff=1)
- feature
Optional: Column name of Column including the Metabolite identifiers. This MUST BE THE SAME in each of your Input files. Default="Metabolite"
- save_table
Optional: File types for the analysis results are: "csv", "xlsx", "txt" default: "csv"
- method_background
Optional: Background method `Intra|core, Intra&core, core, Intra or * Default="Intra&core"
- path
Optional: Path to the folder the results should be saved at. default: NULL
Value
List of two DFs: 1. summary of the cluster count and 2. the detailed information of each metabolites in the clusters.
Examples
data(medium_raw)
Media <- medium_raw %>% tibble::column_to_rownames("Code")
ResM <- processing(
data = Media[-c(40:45), -c(1:3)],
metadata_sample = Media[-c(40:45), c(1:3)],
metadata_info = c(
Conditions = "Conditions",
Biological_Replicates = "Biological_Replicates",
core_norm_factor = "GrowthFactor",
core_media = "blank"
),
core = TRUE
)
#> For Consumption Release experiment we are using the method from Jain M. REF: Jain et. al, (2012), Science 336(6084):1040-4, doi: 10.1126/science.1218595.
#> feature_filtering: Here we apply the modified 80%-filtering rule that takes the class information (Column `Conditions`) into account, which additionally reduces the effect of missing values (REF: Yang et. al., (2015), doi: 10.3389/fmolb.2015.00004). Filtering value selected: 0.8
#> 3 metabolites where removed: N-acetylaspartylglutamate, hypotaurine, S-(2-succinyl)cysteine
#> Missing Value Imputation: Missing value imputation is performed, as a complementary approach to address the missing value problem, where the missing values are imputing using the `half minimum value`. REF: Wei et. al., (2018), Reports, 8, 663, doi:https://doi.org/10.1038/s41598-017-19120-0
#> NA values were found in Control_media samples for metabolites. For metabolites including NAs mvi is performed unless all samples of a metabolite are NA.
#> Metabolites with high NA load (>20%) in Control_media samples are: dihydroorotate.
#> Metabolites with only NAs (= 100%) in Control_media samples are: hydroxyphenylpyruvate. Those NAs are set zero as we consider them true zeros
#> Warning: `aes_string()` was deprecated in ggplot2 3.0.0.
#> ℹ Please use tidy evaluation idioms with `aes()`.
#> ℹ See also `vignette("ggplot2-in-packages")` for more information.
#> ℹ The deprecated feature was likely used in the MetaProViz package.
#> Please report the issue at <https://github.com/saezlab/MetaProViz/issues>.
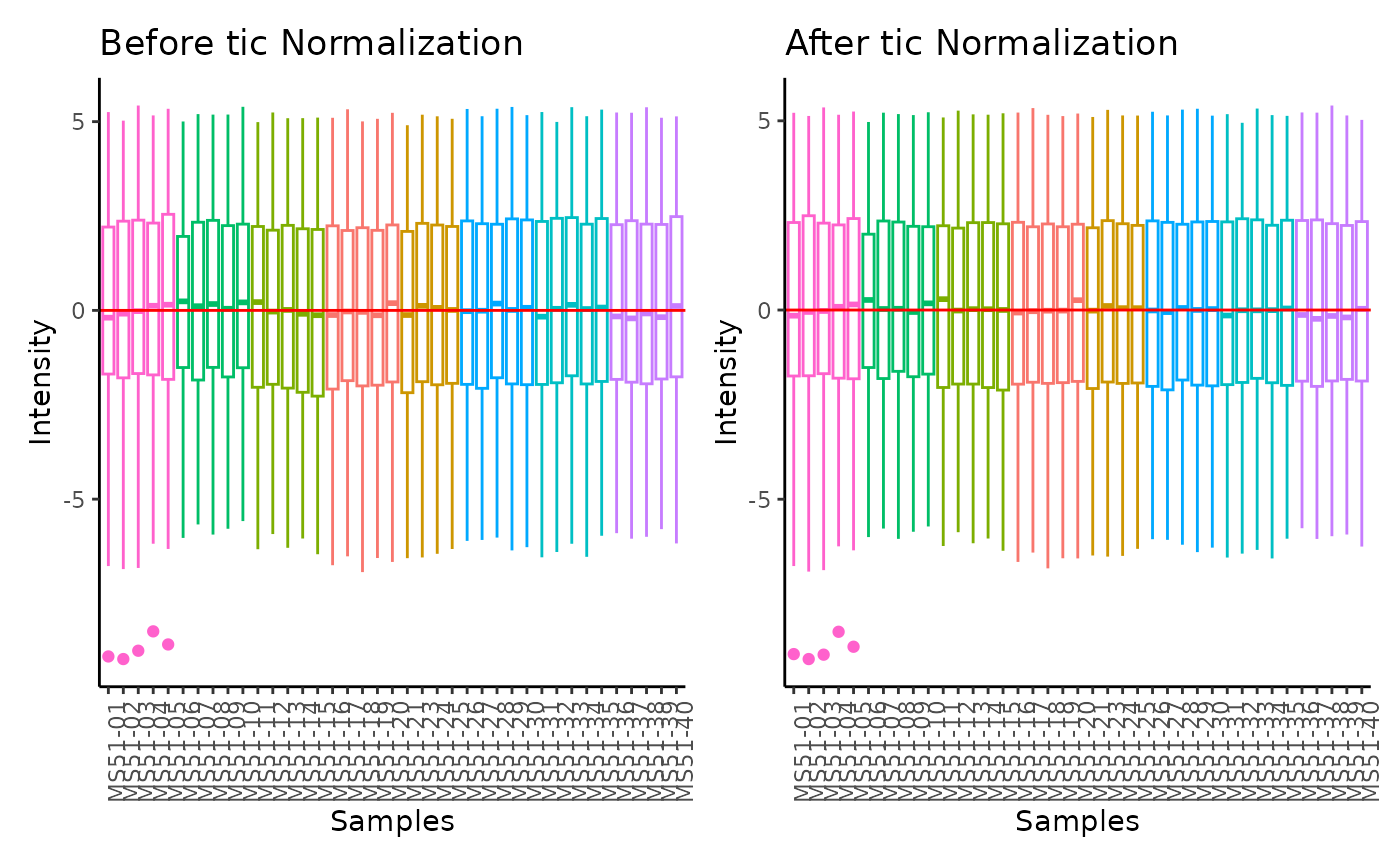
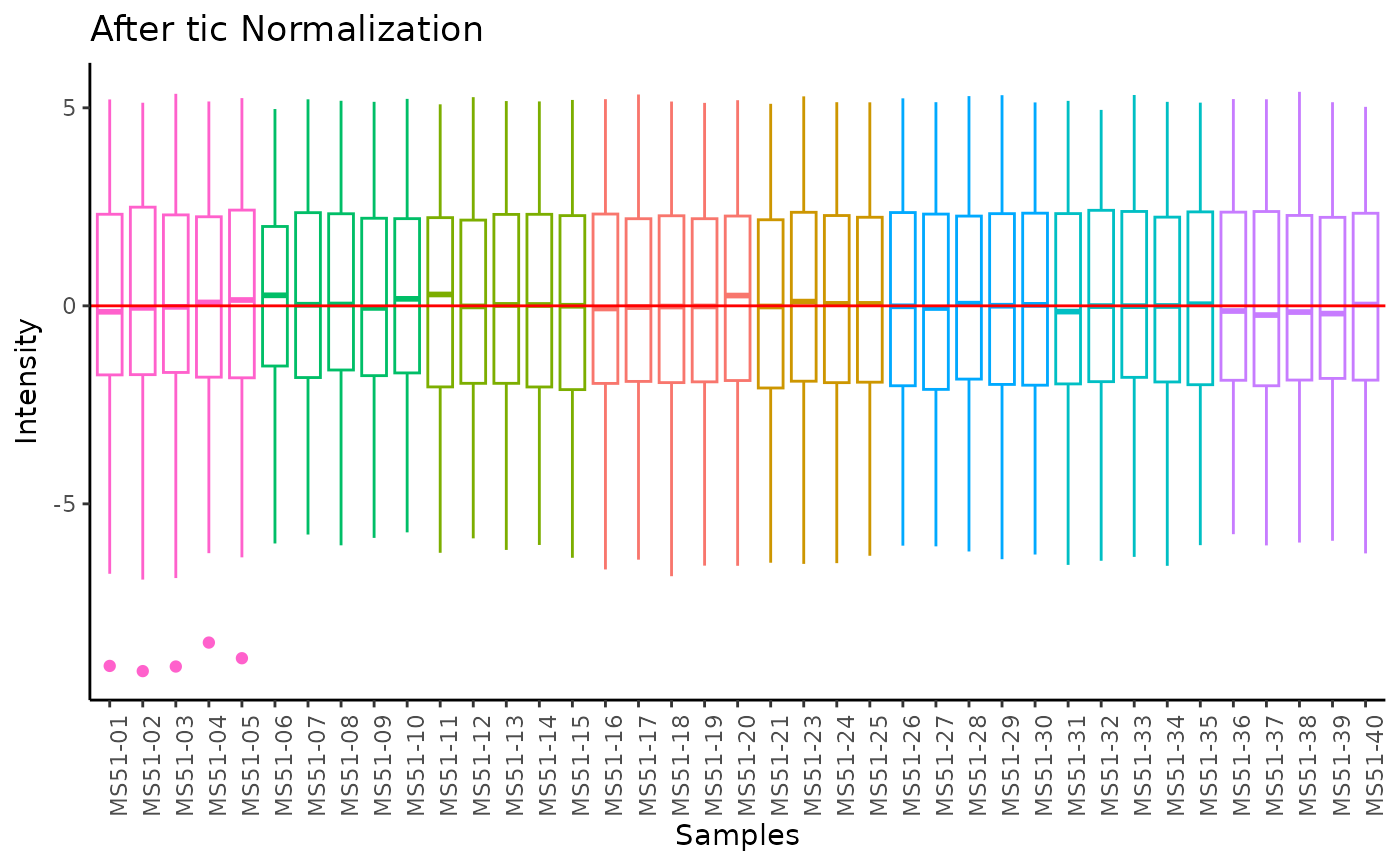
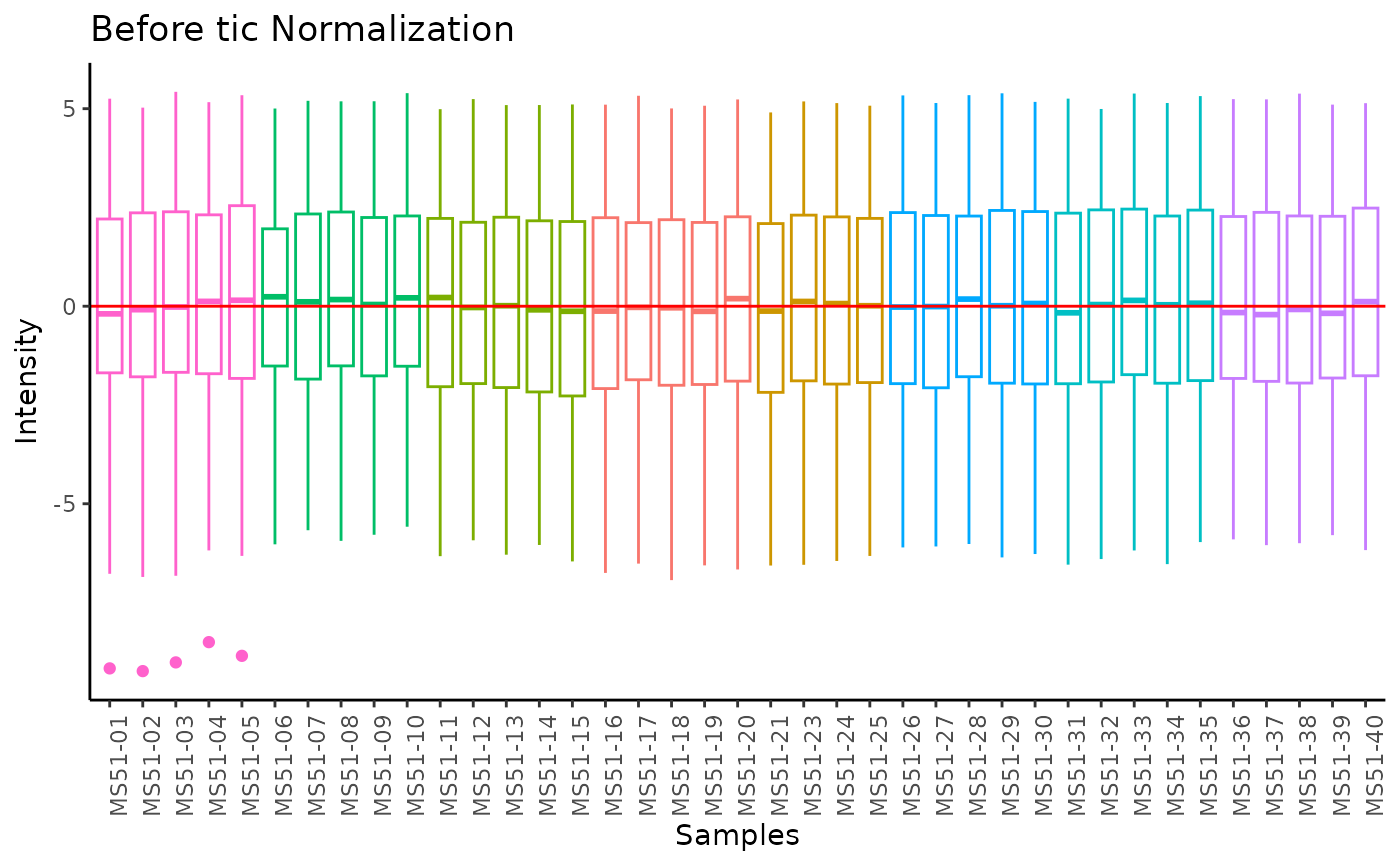
#> total Ion Count (tic) normalization: total Ion Count (tic) normalization is used to reduce the variation from non-biological sources, while maintaining the biological variation. REF: Wulff et. al., (2018), Advances in Bioscience and Biotechnology, 9, 339-351, doi:https://doi.org/10.4236/abb.2018.98022
#> Warning: Removed 5 rows containing non-finite outside the scale range
#> (`stat_boxplot()`).
#> Warning: Removed 5 rows containing non-finite outside the scale range
#> (`stat_boxplot()`).
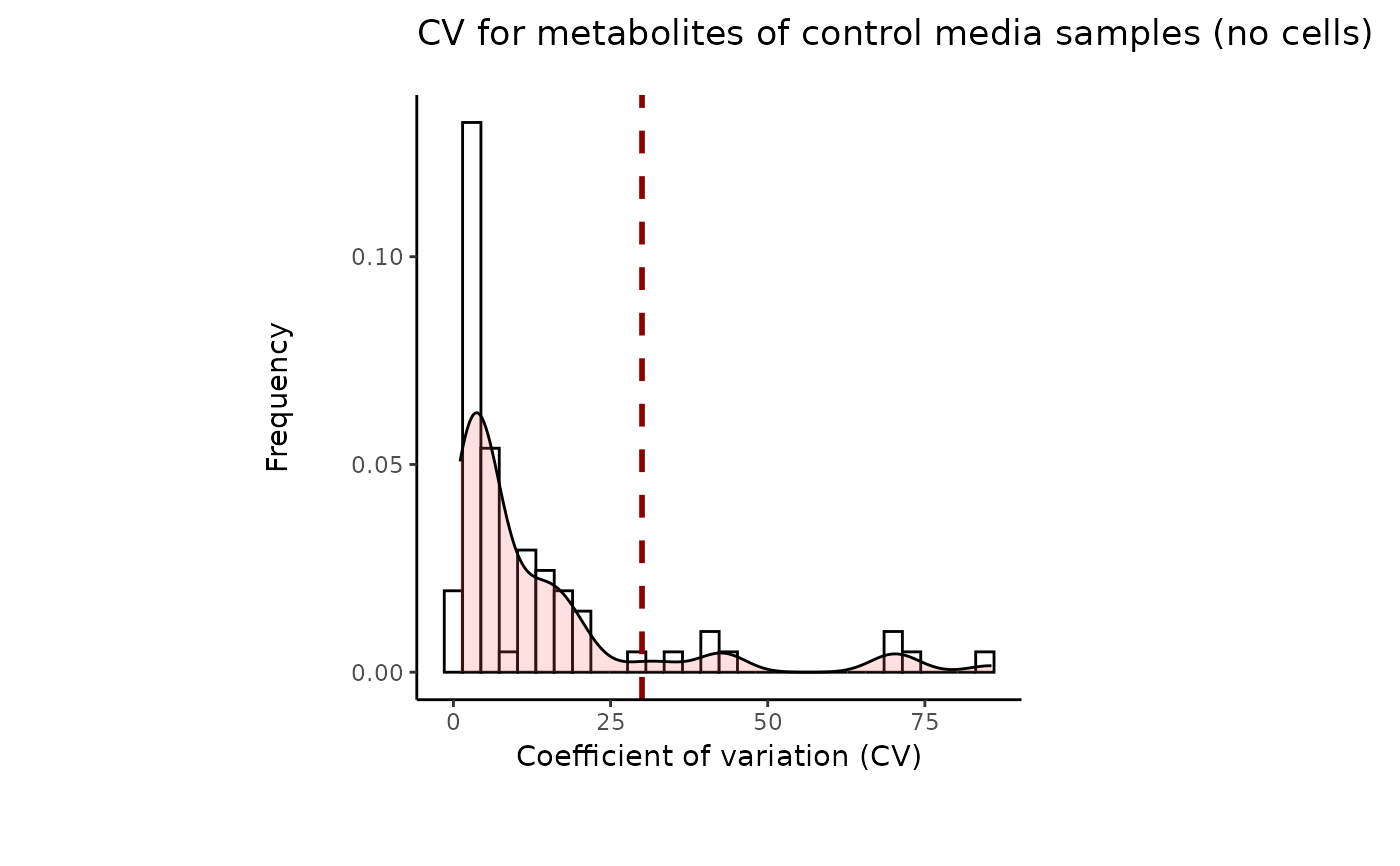
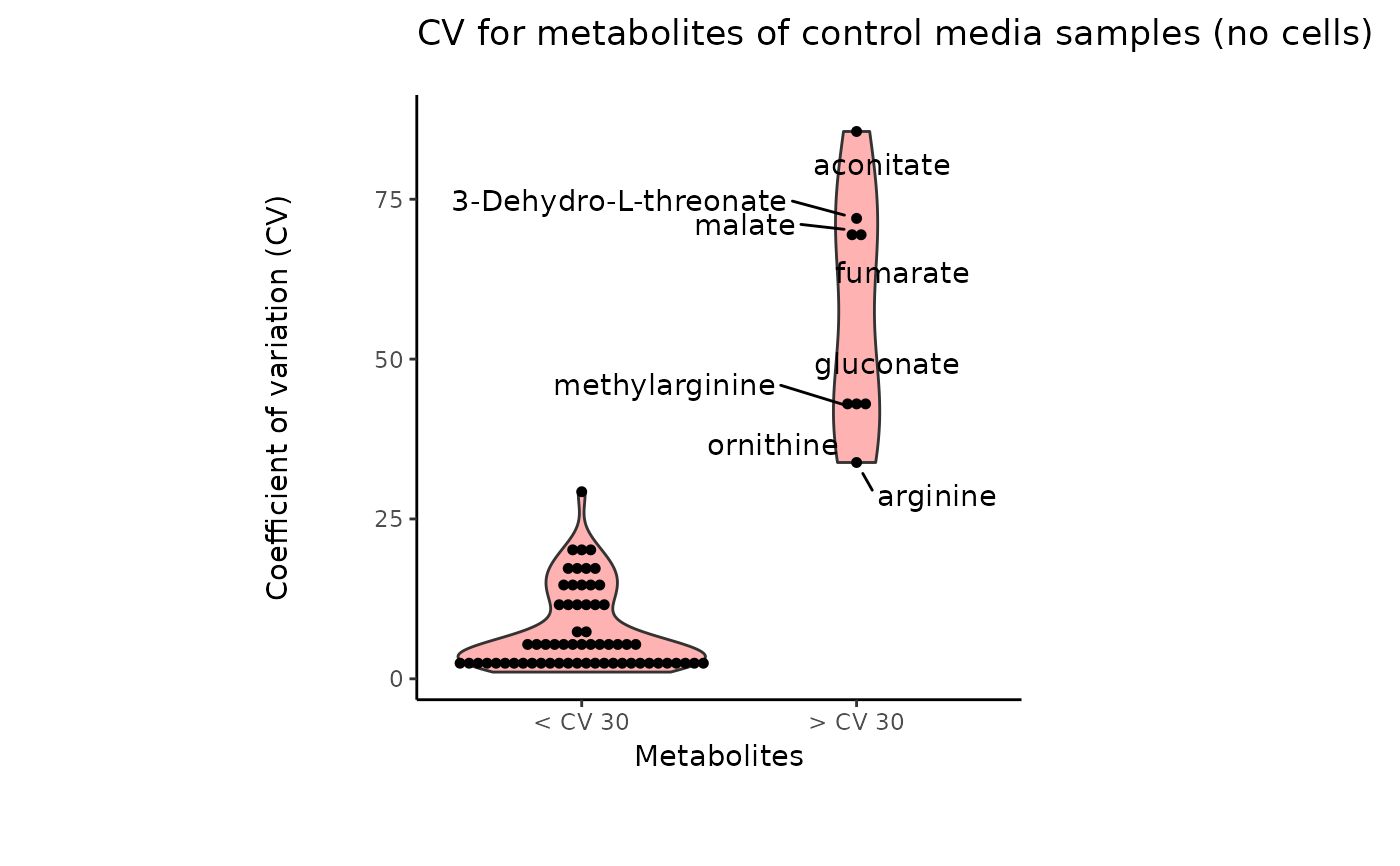
#> 8 of variables have high variability (CV > 30) in the core_media control samples. Consider checking the pooled samples to decide whether to remove these metabolites or not.
#> `stat_bin()` using `bins = 30`. Pick better value `binwidth`.
#> Warning: The following aesthetics were dropped during statistical transformation: label.
#> ℹ This can happen when ggplot fails to infer the correct grouping structure in
#> the data.
#> ℹ Did you forget to specify a `group` aesthetic or to convert a numerical
#> variable into a factor?
#> Bin width defaults to 1/30 of the range of the data. Pick better value with
#> `binwidth`.
#> Warning: The following aesthetics were dropped during statistical transformation: label.
#> ℹ This can happen when ggplot fails to infer the correct grouping structure in
#> the data.
#> ℹ Did you forget to specify a `group` aesthetic or to convert a numerical
#> variable into a factor?
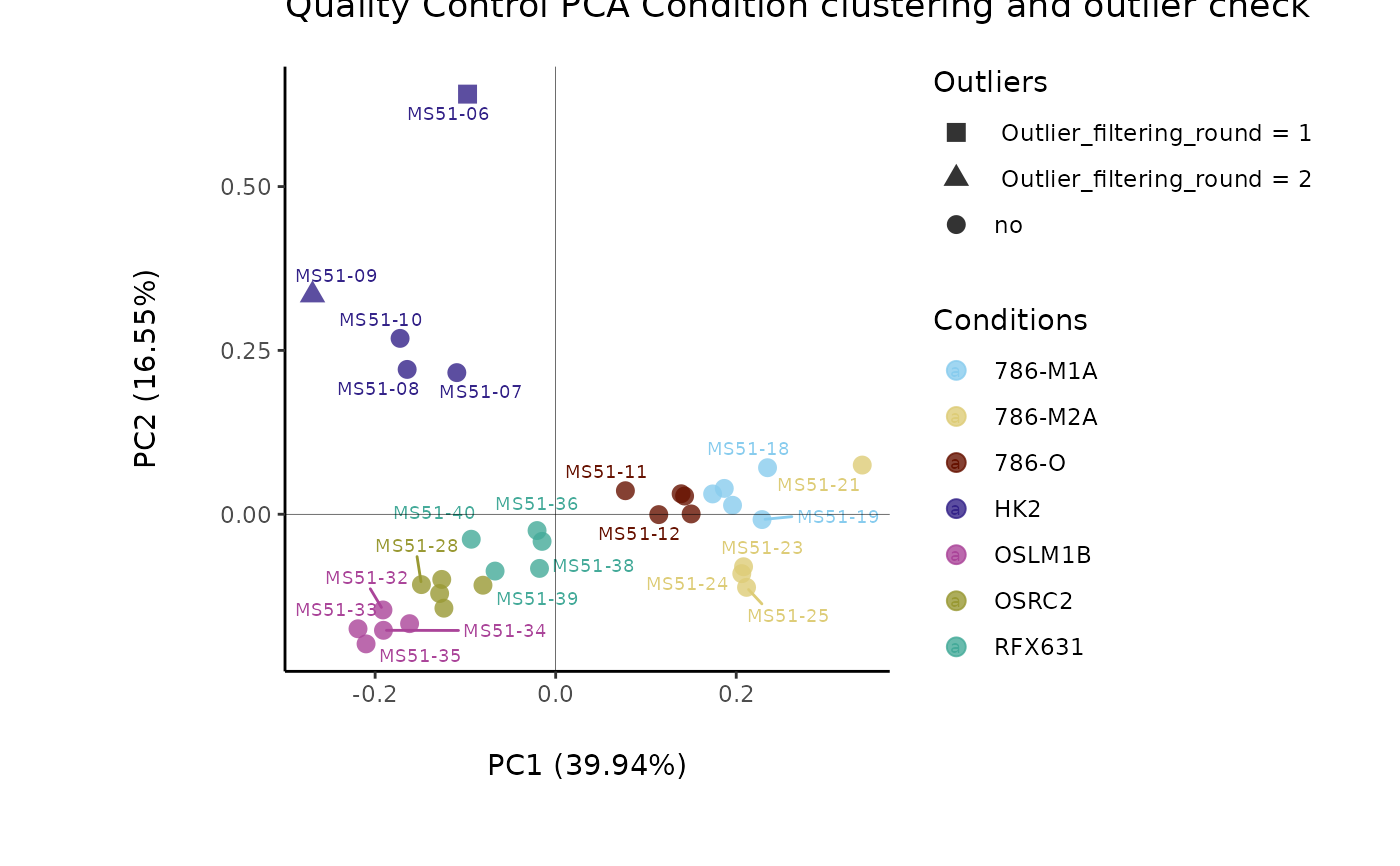
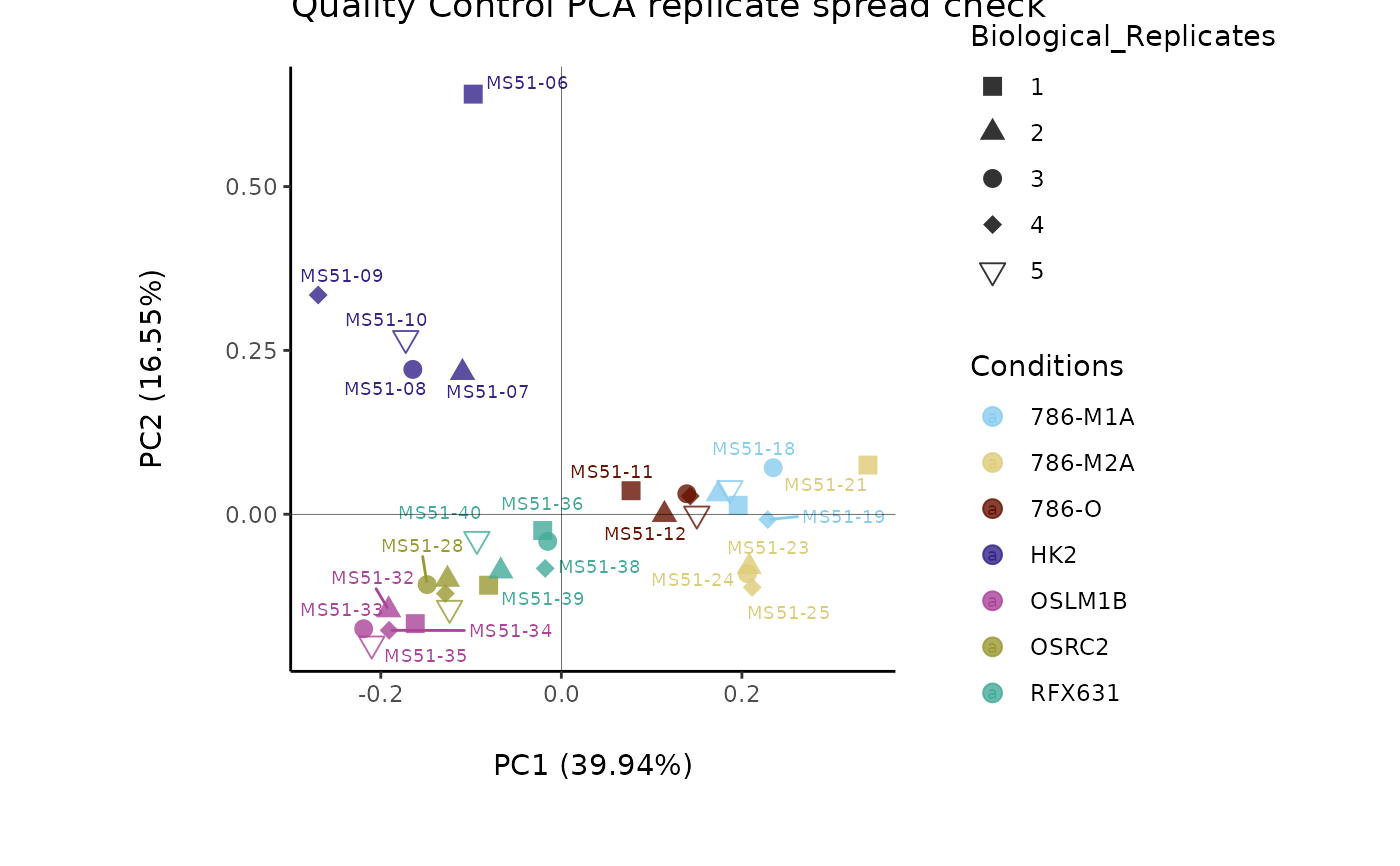
#> Warning: The core_media samples MS51-06 were found to be different from the rest. They will not be included in the sum of the core_media samples.
#> core data are normalised by substracting mean (blank) from each sample and multiplying with the core_norm_factor
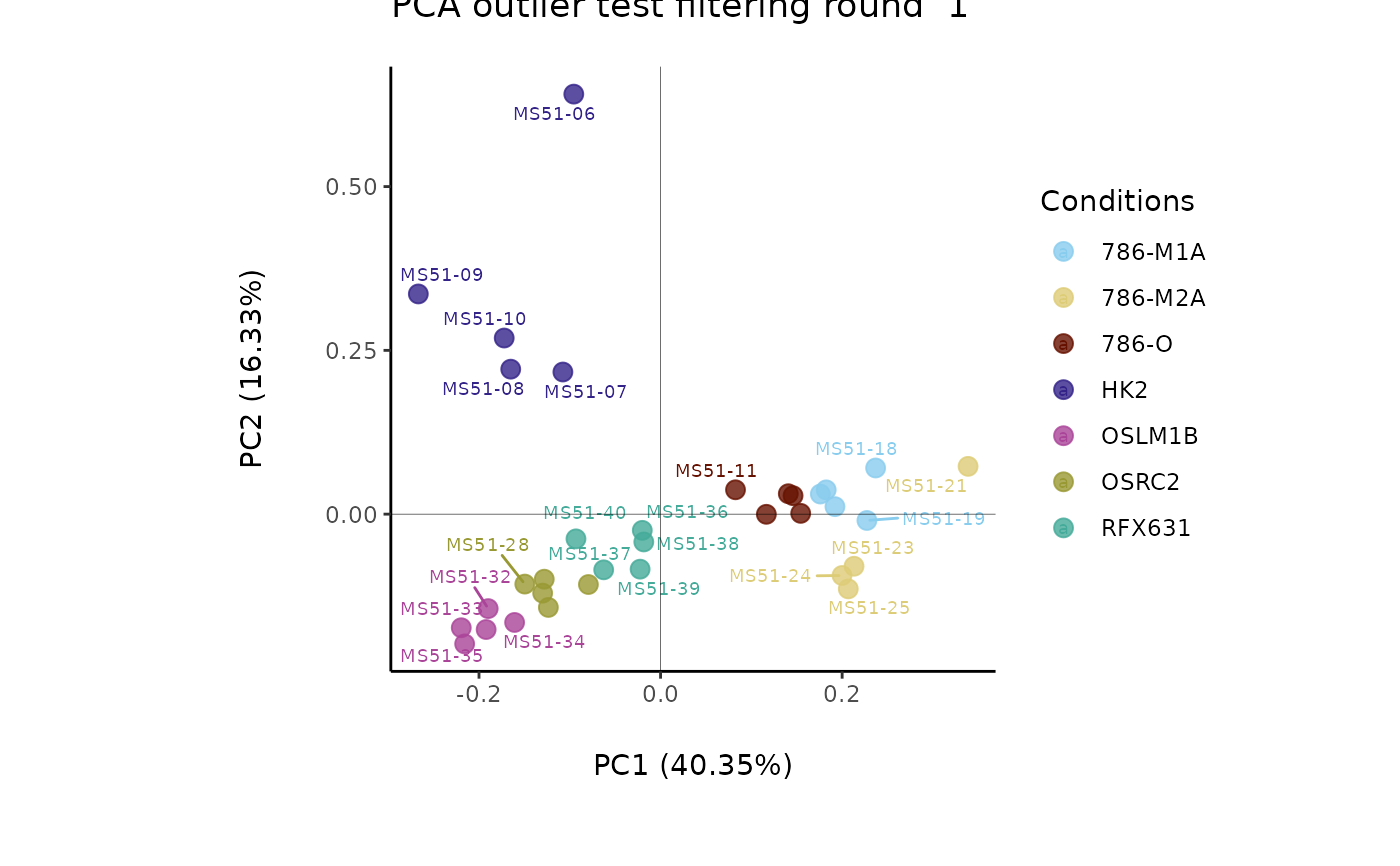
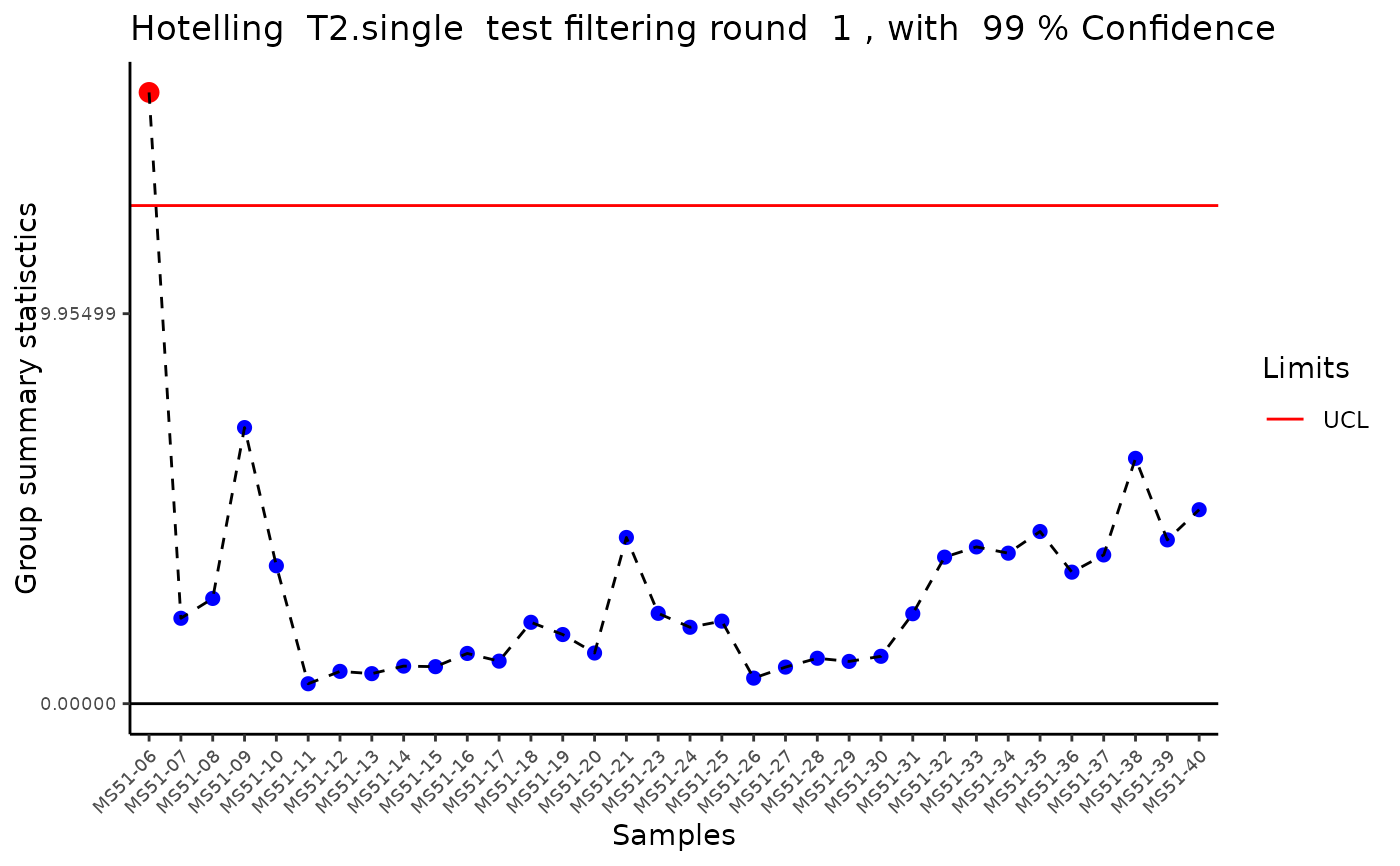
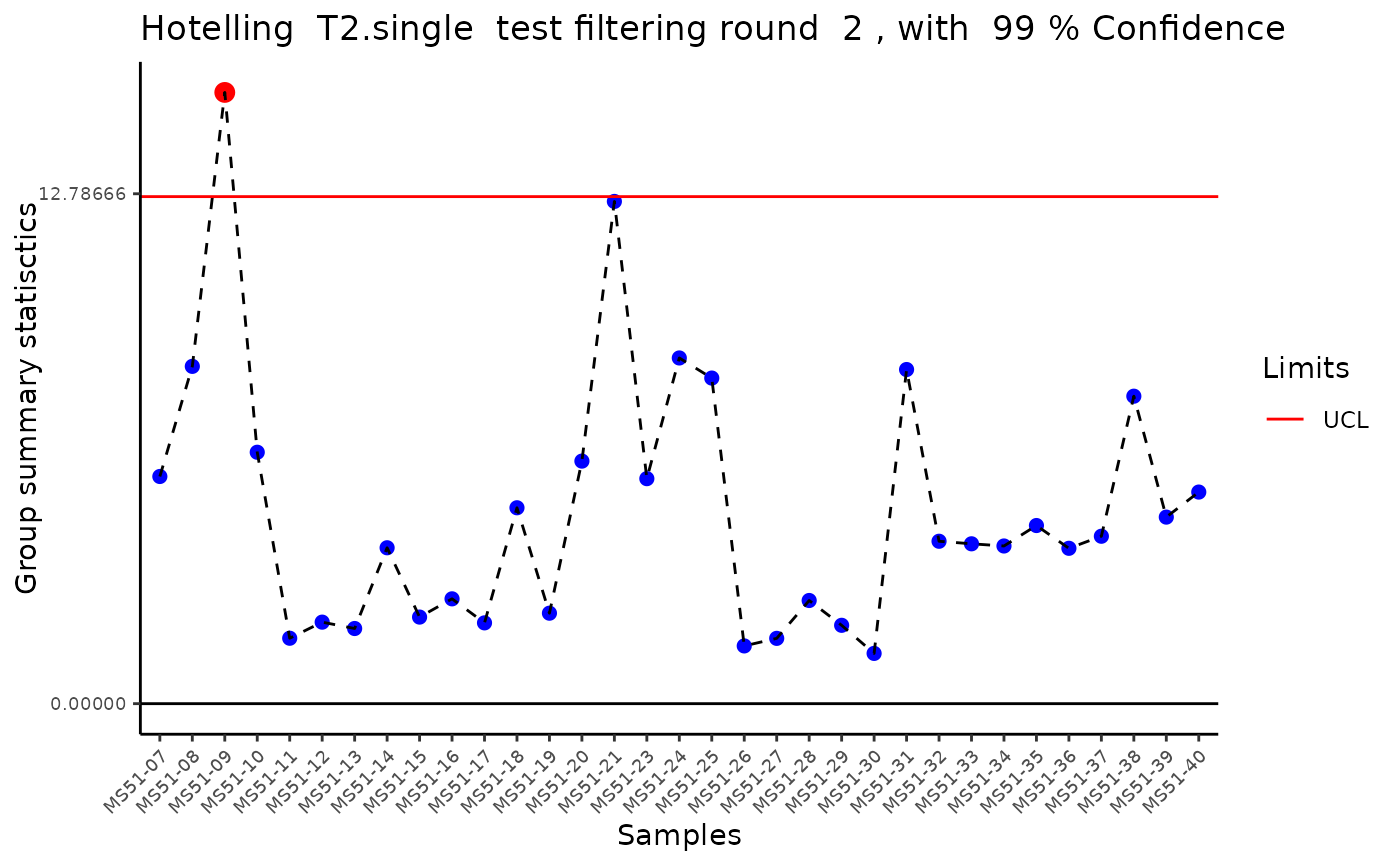
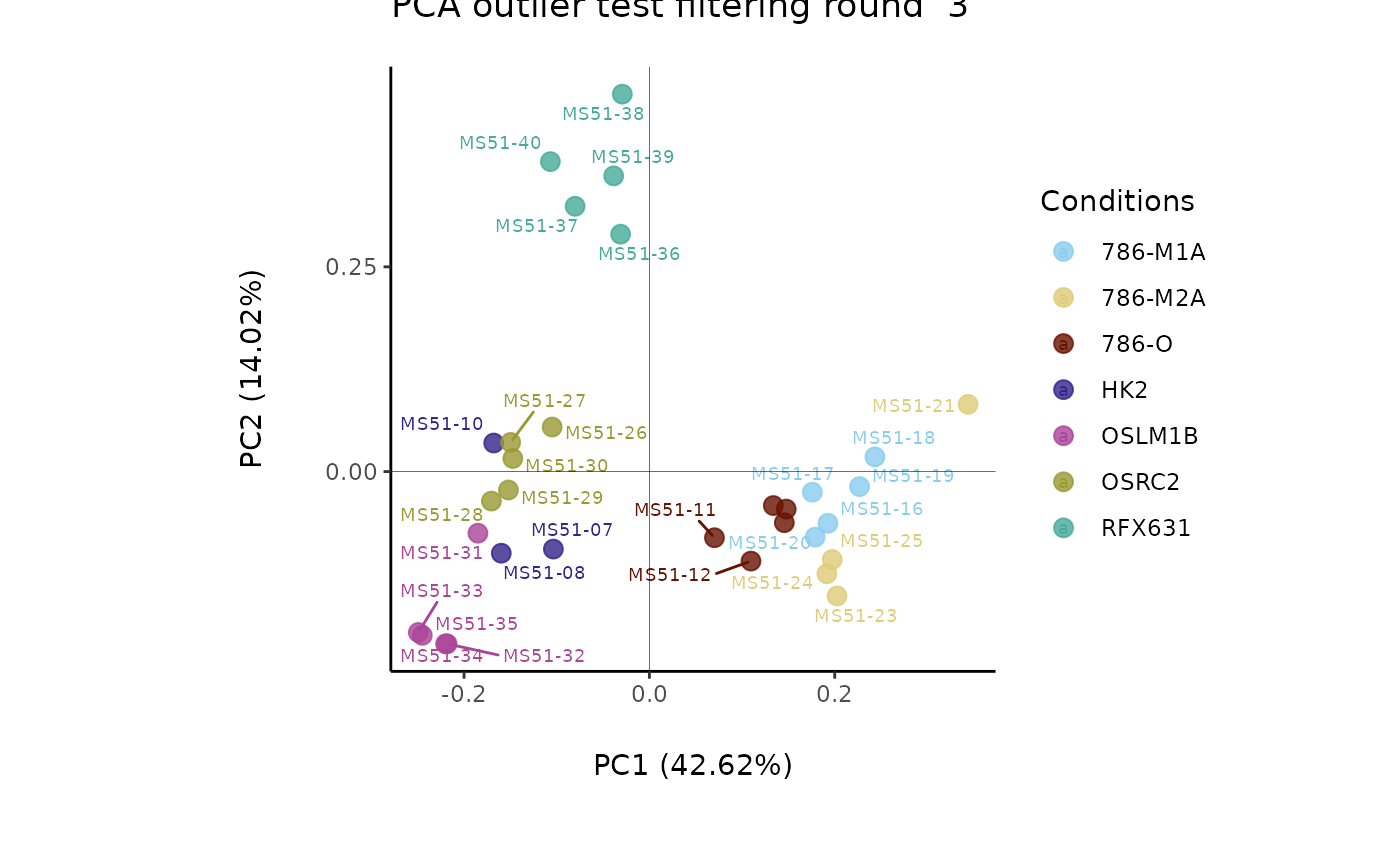
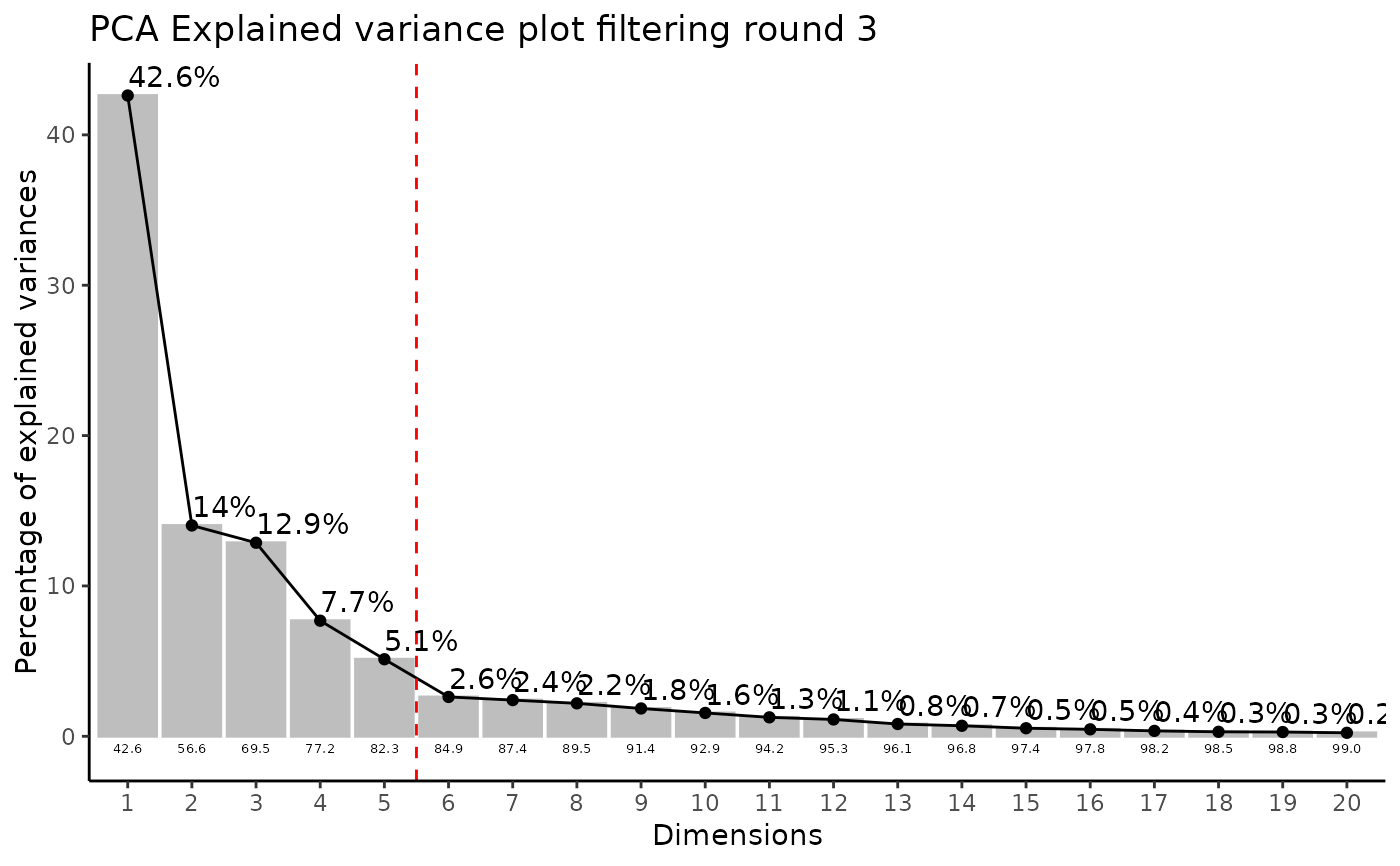
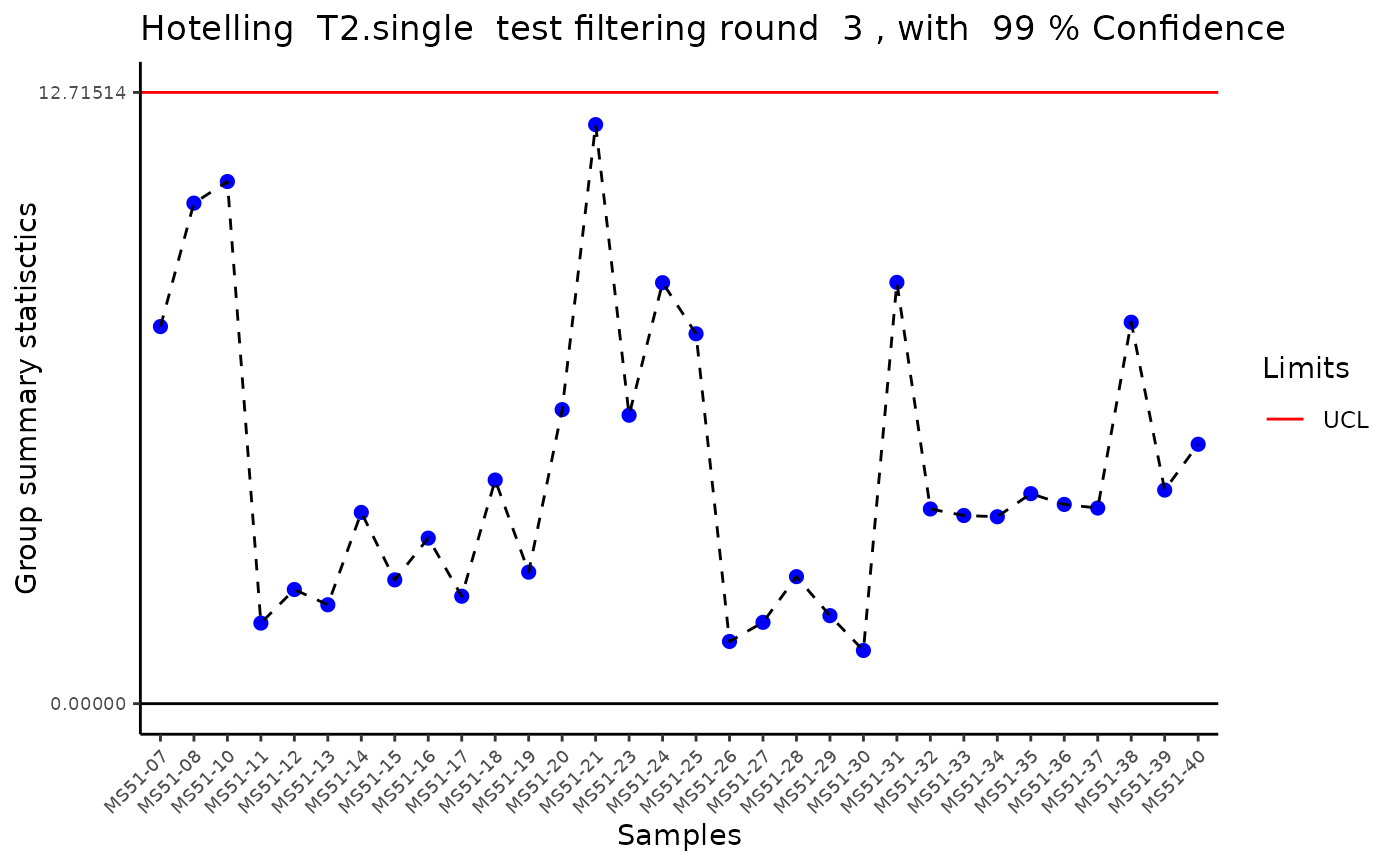
#> Outlier detection: Identification of outlier samples is performed using Hotellin's T2 test to define sample outliers in a mathematical way (Confidence = 0.99 ~ p.val < 0.01) (REF: Hotelling, H. (1931), Annals of Mathematical Statistics. 2 (3), 360-378, doi:https://doi.org/10.1214/aoms/1177732979). hotellins_confidence value selected: 0.99
#> There are possible outlier samples in the data
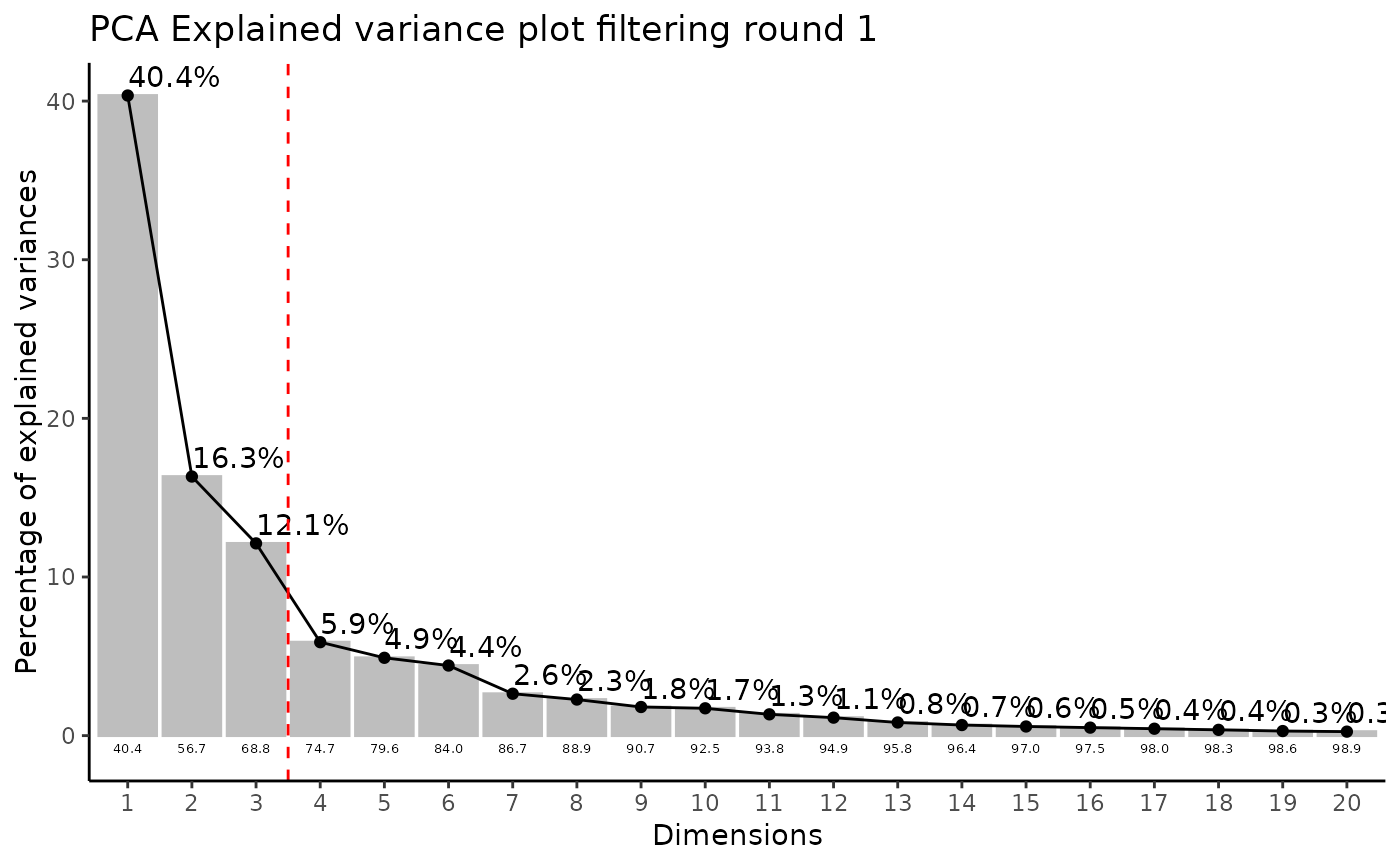
#> Filtering round 1 Outlier Samples: MS51-06
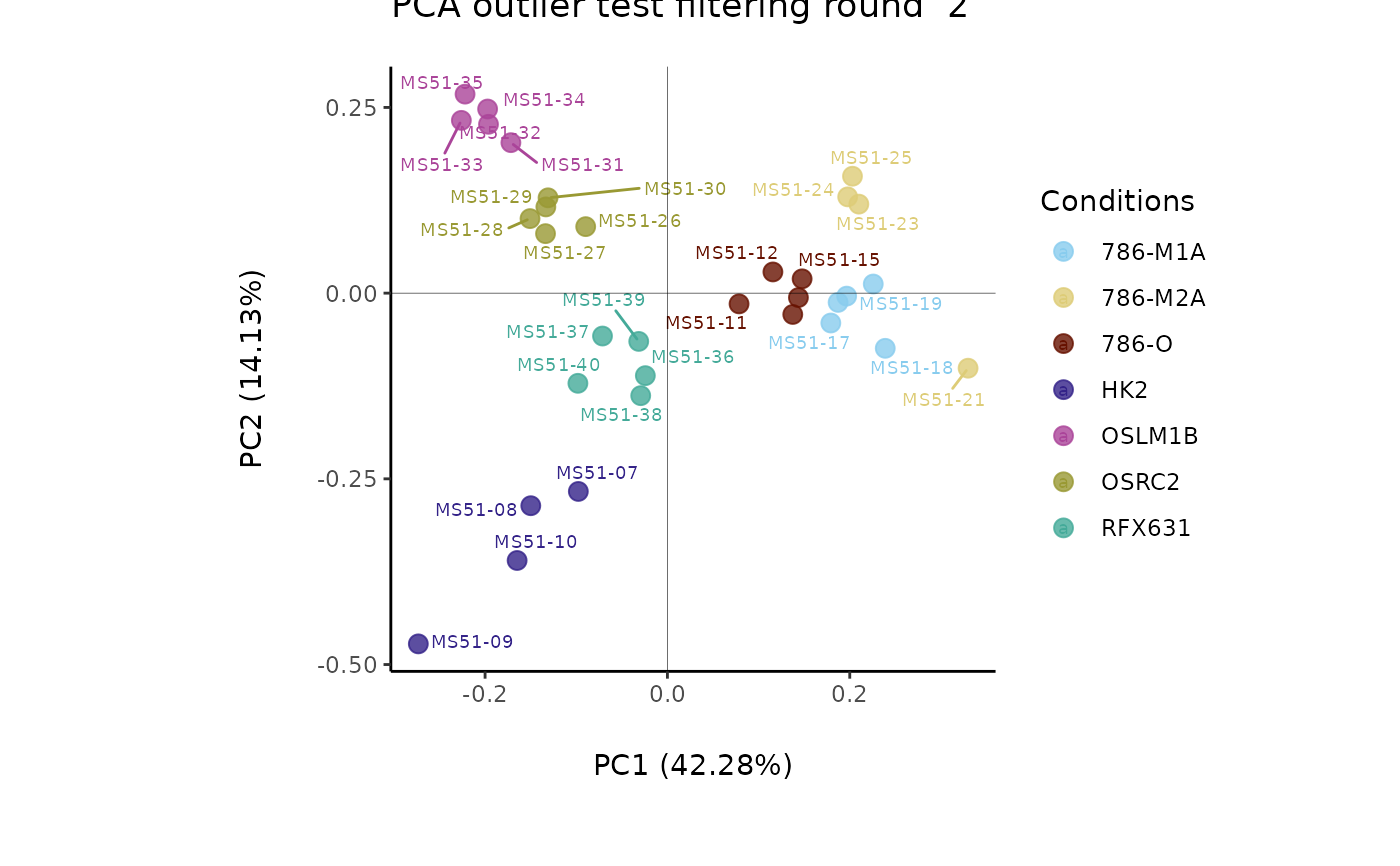
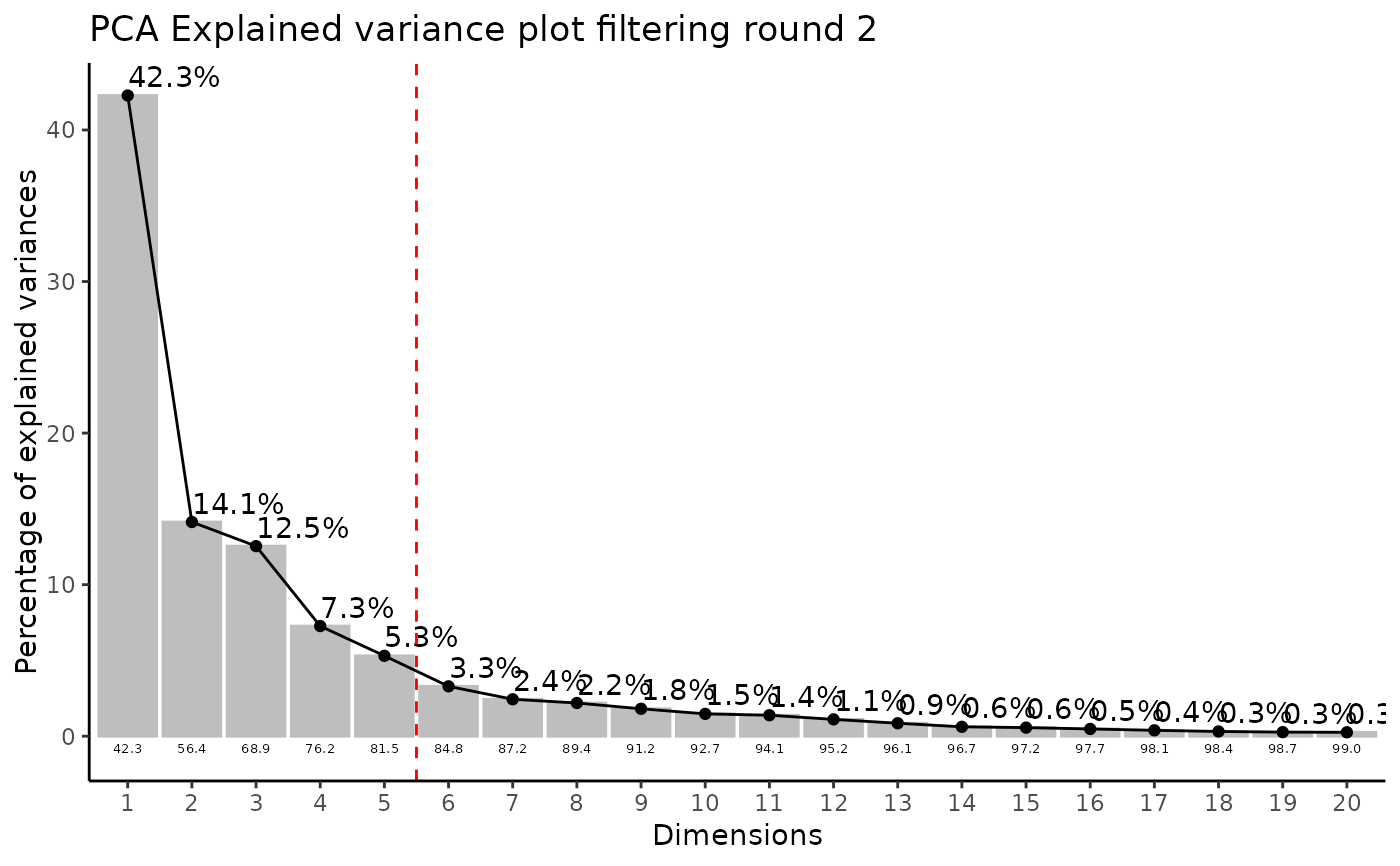
#> Filtering round 2 Outlier Samples: MS51-09
#> Warning: Removed 5 rows containing non-finite outside the scale range
#> (`stat_boxplot()`).
 #> Warning: Removed 5 rows containing non-finite outside the scale range
#> (`stat_boxplot()`).
#> Warning: Removed 5 rows containing non-finite outside the scale range
#> (`stat_boxplot()`).
#> Warning: Removed 5 rows containing non-finite outside the scale range
#> (`stat_boxplot()`).
 #> Warning: Removed 5 rows containing non-finite outside the scale range
#> (`stat_boxplot()`).
#> Warning: ggrepel: 9 unlabeled data points (too many overlaps). Consider increasing max.overlaps
 #> Warning: ggrepel: 9 unlabeled data points (too many overlaps). Consider increasing max.overlaps
#> Warning: Ignoring empty aesthetic: `width`.
 #> Warning: Ignoring empty aesthetic: `width`.
 #> Warning: ggrepel: 3 unlabeled data points (too many overlaps). Consider increasing max.overlaps
 #> Warning: ggrepel: 4 unlabeled data points (too many overlaps). Consider increasing max.overlaps
#> Warning: Ignoring empty aesthetic: `width`.
 #> Warning: Ignoring empty aesthetic: `width`.
 #> Warning: ggrepel: 3 unlabeled data points (too many overlaps). Consider increasing max.overlaps
 #> Warning: ggrepel: 3 unlabeled data points (too many overlaps). Consider increasing max.overlaps
#> Warning: Ignoring empty aesthetic: `width`.
 #> Warning: Ignoring empty aesthetic: `width`.
 #> Warning: ggrepel: 8 unlabeled data points (too many overlaps). Consider increasing max.overlaps
 #> Warning: ggrepel: 10 unlabeled data points (too many overlaps). Consider increasing max.overlaps
#> Warning: ggrepel: 8 unlabeled data points (too many overlaps). Consider increasing max.overlaps
 #> Warning: ggrepel: 10 unlabeled data points (too many overlaps). Consider increasing max.overlaps
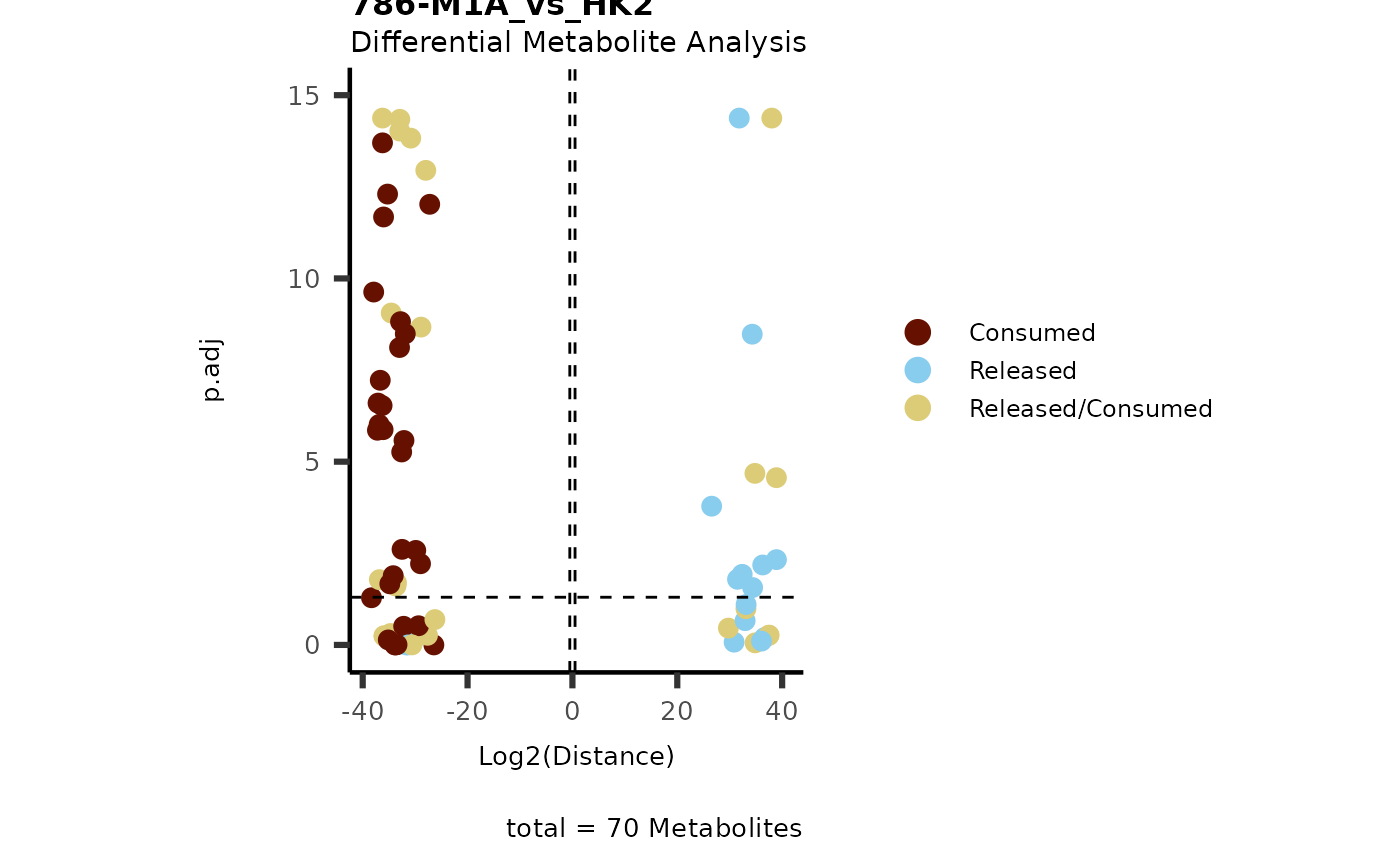
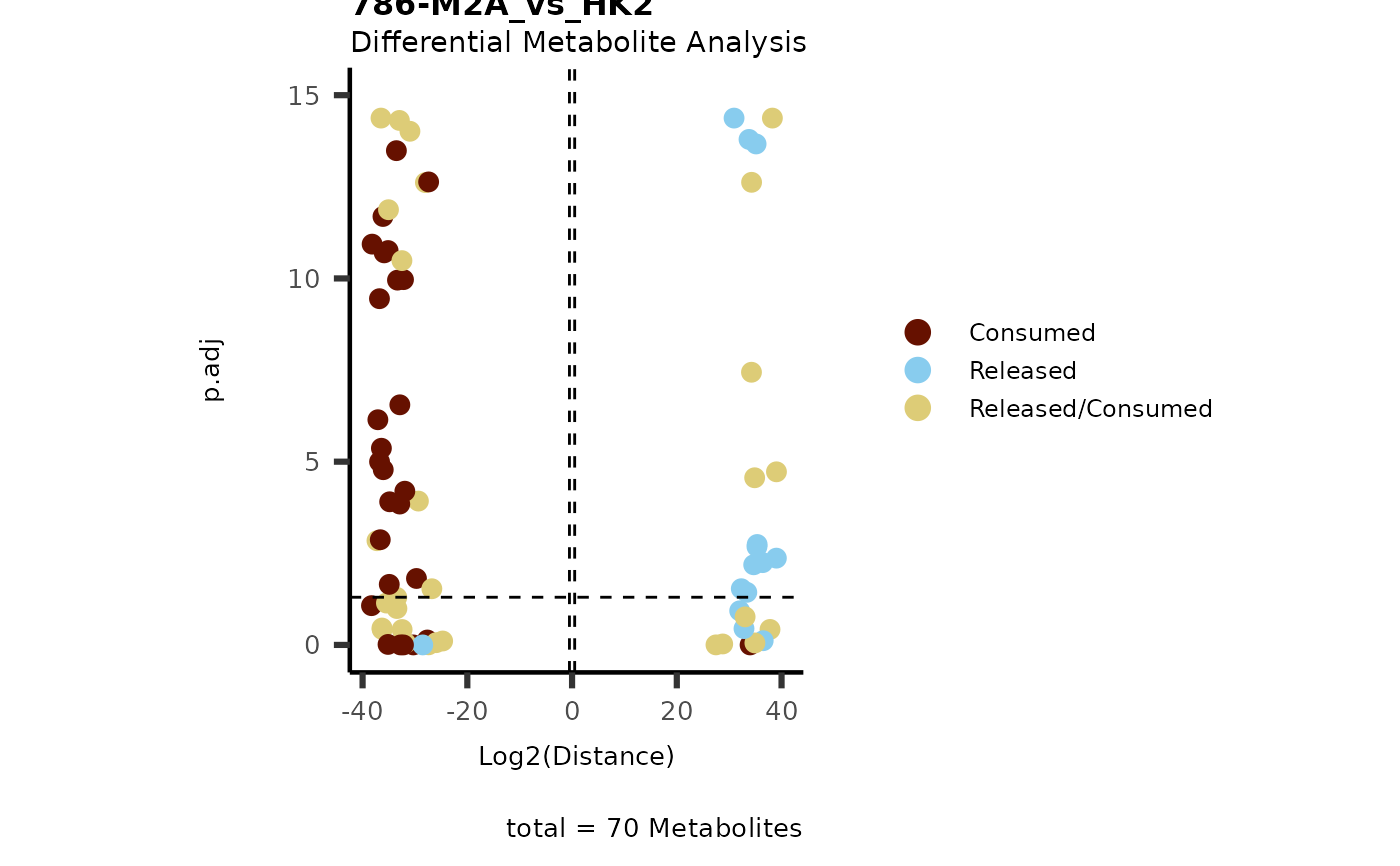
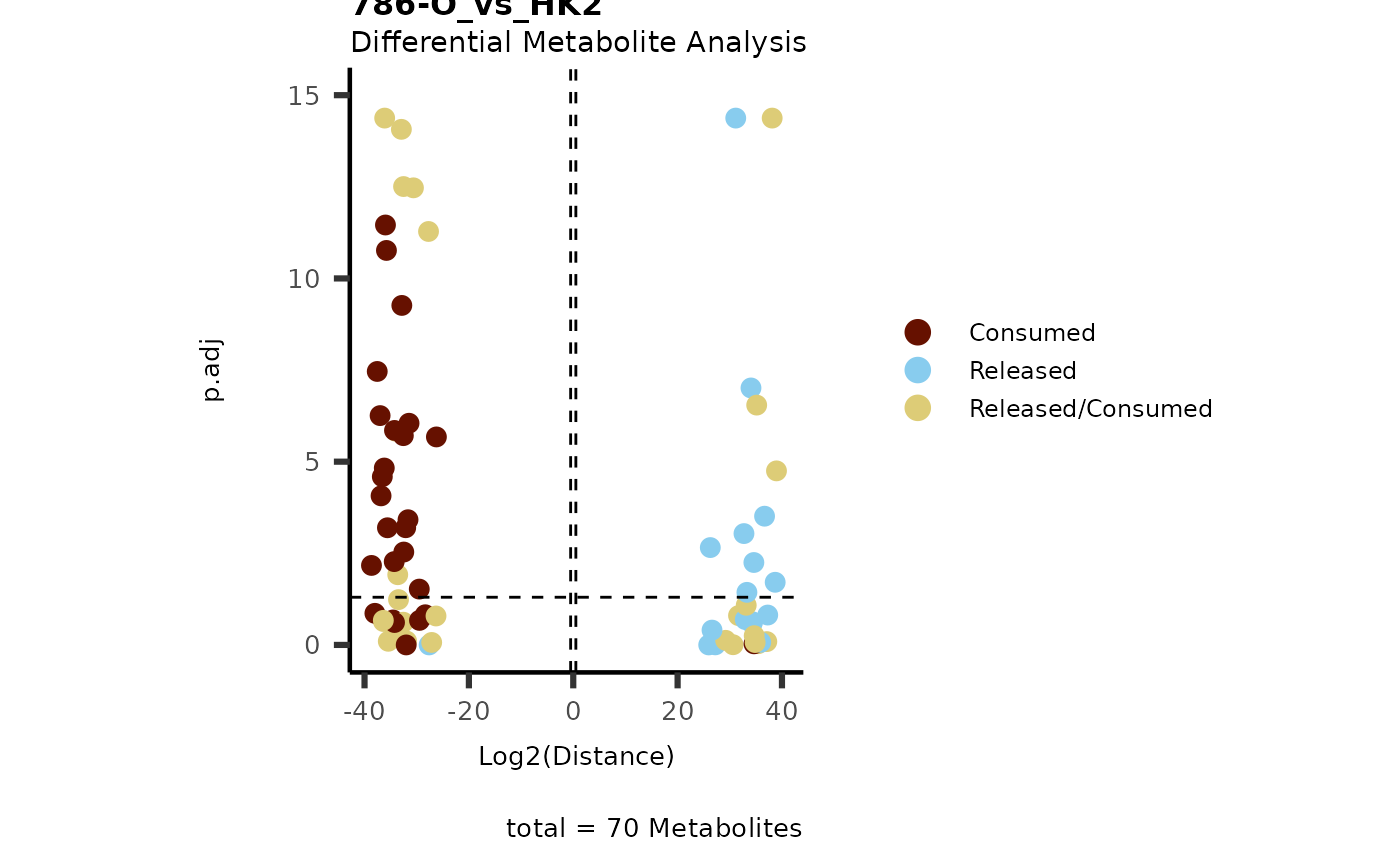
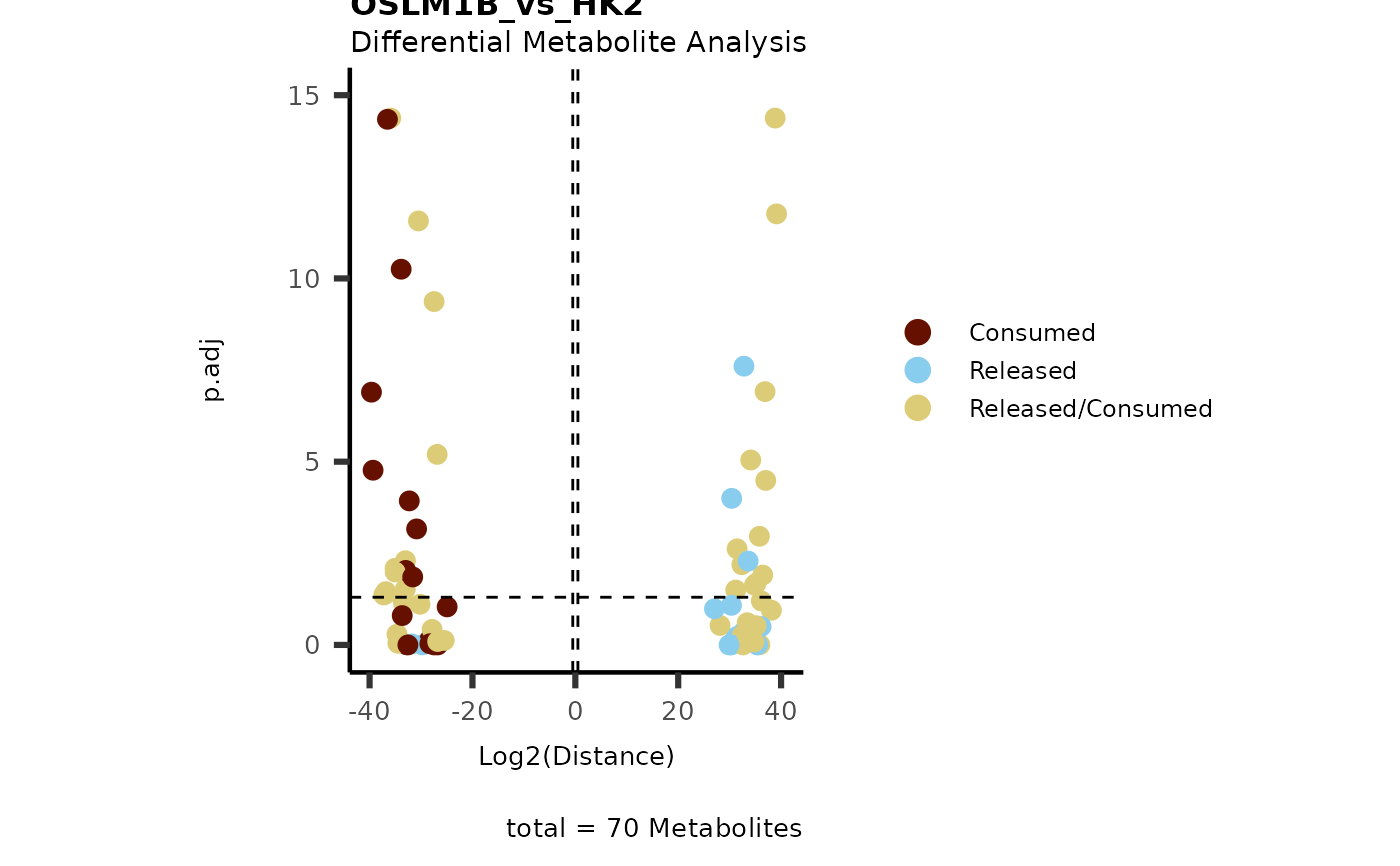
 MediaDMA <- dma(
data = ResM[["DF"]][["Preprocessing_output"]][, -c(1:4)],
metadata_sample = ResM[["DF"]][["Preprocessing_output"]][, c(1:4)],
metadata_info = c(
Conditions = "Conditions",
Numerator = NULL,
Denominator = "HK2"
),
pval = "aov",
core = TRUE
)
#> There are no NA/0 values
#> Warning: Computation failed in `stat_bin()`.
#> Caused by error in `bin_breaks_width()`:
#> ! The number of histogram bins must be less than 1,000,000.
#> ℹ Did you make `binwidth` too small?
#> Warning: Removed 250 rows containing non-finite outside the scale range (`stat_bin()`).
#> Warning: Computation failed in `stat_bin()`.
#> Caused by error in `bin_breaks_width()`:
#> ! The number of histogram bins must be less than 1,000,000.
#> ℹ Did you make `binwidth` too small?
#> Warning: Removed 250 rows containing non-finite outside the scale range
#> (`stat_density()`).
#> Warning: Computation failed in `stat_bin()`.
#> Caused by error in `bin_breaks_width()`:
#> ! The number of histogram bins must be less than 1,000,000.
#> ℹ Did you make `binwidth` too small?
#> Warning: Removed 256 rows containing non-finite outside the scale range (`stat_bin()`).
#> Warning: Computation failed in `stat_bin()`.
#> Caused by error in `bin_breaks_width()`:
#> ! The number of histogram bins must be less than 1,000,000.
#> ℹ Did you make `binwidth` too small?
#> Warning: Removed 256 rows containing non-finite outside the scale range
#> (`stat_density()`).
#> Warning: Computation failed in `stat_bin()`.
#> Caused by error in `bin_breaks_width()`:
#> ! The number of histogram bins must be less than 1,000,000.
#> ℹ Did you make `binwidth` too small?
#> Warning: Removed 272 rows containing non-finite outside the scale range (`stat_bin()`).
#> Warning: Computation failed in `stat_bin()`.
#> Caused by error in `bin_breaks_width()`:
#> ! The number of histogram bins must be less than 1,000,000.
#> ℹ Did you make `binwidth` too small?
#> Warning: Removed 272 rows containing non-finite outside the scale range
#> (`stat_density()`).
#> Warning: Computation failed in `stat_bin()`.
#> Caused by error in `bin_breaks_width()`:
#> ! The number of histogram bins must be less than 1,000,000.
#> ℹ Did you make `binwidth` too small?
#> Warning: Removed 218 rows containing non-finite outside the scale range (`stat_bin()`).
#> Warning: Computation failed in `stat_bin()`.
#> Caused by error in `bin_breaks_width()`:
#> ! The number of histogram bins must be less than 1,000,000.
#> ℹ Did you make `binwidth` too small?
#> Warning: Removed 218 rows containing non-finite outside the scale range
#> (`stat_density()`).
#> Warning: Computation failed in `stat_bin()`.
#> Caused by error in `bin_breaks_width()`:
#> ! The number of histogram bins must be less than 1,000,000.
#> ℹ Did you make `binwidth` too small?
#> Warning: Removed 278 rows containing non-finite outside the scale range (`stat_bin()`).
#> Warning: Computation failed in `stat_bin()`.
#> Caused by error in `bin_breaks_width()`:
#> ! The number of histogram bins must be less than 1,000,000.
#> ℹ Did you make `binwidth` too small?
#> Warning: Removed 278 rows containing non-finite outside the scale range
#> (`stat_density()`).
#> Warning: Computation failed in `stat_bin()`.
#> Caused by error in `bin_breaks_width()`:
#> ! The number of histogram bins must be less than 1,000,000.
#> ℹ Did you make `binwidth` too small?
#> Warning: Removed 255 rows containing non-finite outside the scale range (`stat_bin()`).
#> Warning: Computation failed in `stat_bin()`.
#> Caused by error in `bin_breaks_width()`:
#> ! The number of histogram bins must be less than 1,000,000.
#> ℹ Did you make `binwidth` too small?
#> Warning: Removed 255 rows containing non-finite outside the scale range
#> (`stat_density()`).
#> Warning: Computation failed in `stat_bin()`.
#> Caused by error in `bin_breaks_width()`:
#> ! The number of histogram bins must be less than 1,000,000.
#> ℹ Did you make `binwidth` too small?
#> Warning: Removed 285 rows containing non-finite outside the scale range (`stat_bin()`).
#> Warning: Computation failed in `stat_bin()`.
#> Caused by error in `bin_breaks_width()`:
#> ! The number of histogram bins must be less than 1,000,000.
#> ℹ Did you make `binwidth` too small?
#> Warning: Removed 285 rows containing non-finite outside the scale range
#> (`stat_density()`).
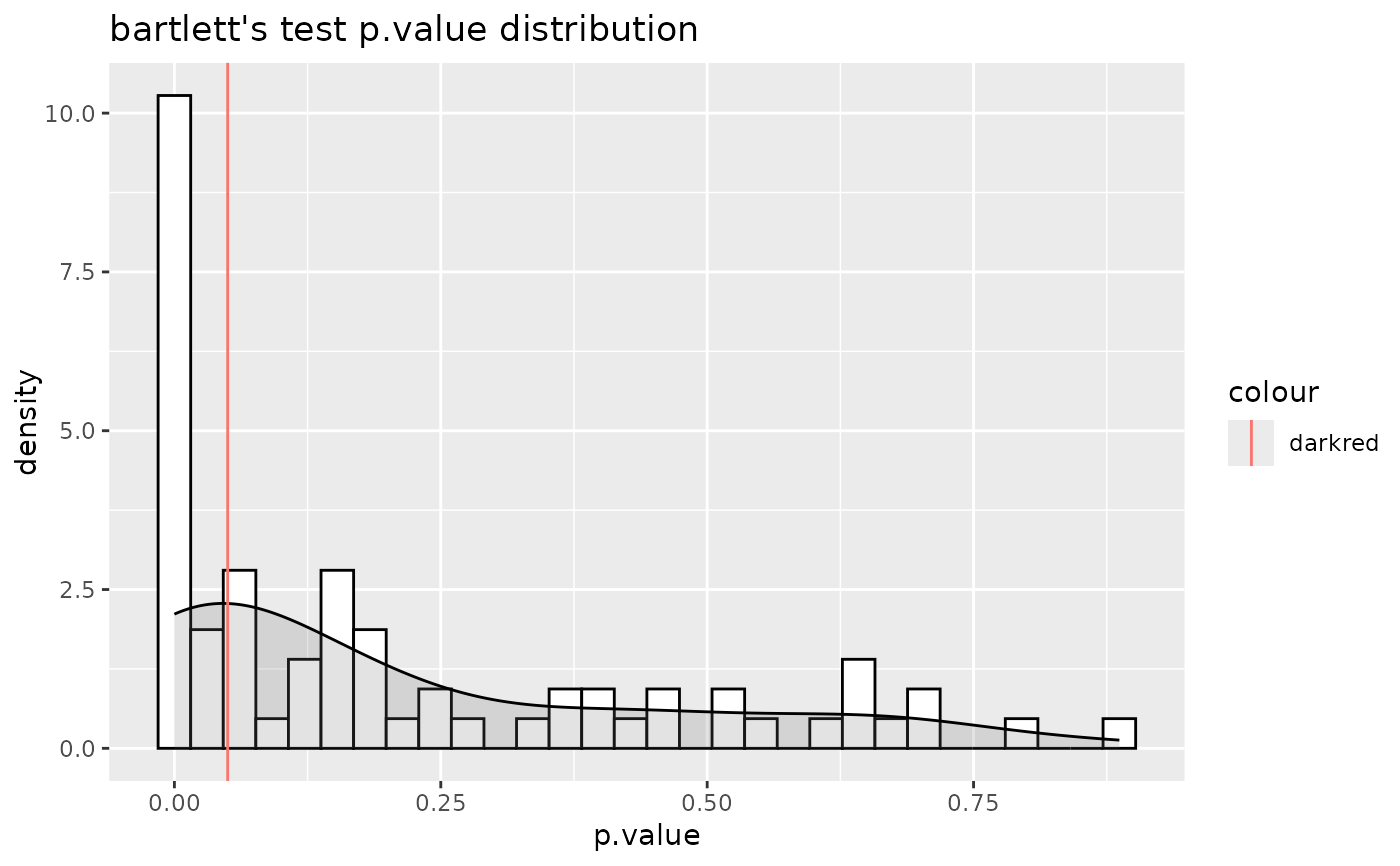
#> For 62.86% of metabolites the group variances are equal.
#> Warning: Removed 250 rows containing non-finite outside the scale range (`stat_bin()`).
#> Warning: Computation failed in `stat_bin()`.
#> Caused by error in `bin_breaks_width()`:
#> ! The number of histogram bins must be less than 1,000,000.
#> ℹ Did you make `binwidth` too small?
#> Warning: Removed 250 rows containing non-finite outside the scale range
#> (`stat_density()`).
#> Warning: Removed 256 rows containing non-finite outside the scale range (`stat_bin()`).
#> Warning: Computation failed in `stat_bin()`.
#> Caused by error in `bin_breaks_width()`:
#> ! The number of histogram bins must be less than 1,000,000.
#> ℹ Did you make `binwidth` too small?
#> Warning: Removed 256 rows containing non-finite outside the scale range
#> (`stat_density()`).
 #> Warning: Removed 256 rows containing non-finite outside the scale range (`stat_bin()`).
#> Warning: Computation failed in `stat_bin()`.
#> Caused by error in `bin_breaks_width()`:
#> ! The number of histogram bins must be less than 1,000,000.
#> ℹ Did you make `binwidth` too small?
#> Warning: Removed 256 rows containing non-finite outside the scale range
#> (`stat_density()`).
#> Warning: Removed 272 rows containing non-finite outside the scale range (`stat_bin()`).
#> Warning: Computation failed in `stat_bin()`.
#> Caused by error in `bin_breaks_width()`:
#> ! The number of histogram bins must be less than 1,000,000.
#> ℹ Did you make `binwidth` too small?
#> Warning: Removed 272 rows containing non-finite outside the scale range
#> (`stat_density()`).
 #> Warning: Removed 272 rows containing non-finite outside the scale range (`stat_bin()`).
#> Warning: Computation failed in `stat_bin()`.
#> Caused by error in `bin_breaks_width()`:
#> ! The number of histogram bins must be less than 1,000,000.
#> ℹ Did you make `binwidth` too small?
#> Warning: Removed 272 rows containing non-finite outside the scale range
#> (`stat_density()`).
#> Warning: Removed 218 rows containing non-finite outside the scale range (`stat_bin()`).
#> Warning: Computation failed in `stat_bin()`.
#> Caused by error in `bin_breaks_width()`:
#> ! The number of histogram bins must be less than 1,000,000.
#> ℹ Did you make `binwidth` too small?
#> Warning: Removed 218 rows containing non-finite outside the scale range
#> (`stat_density()`).
 #> Warning: Removed 218 rows containing non-finite outside the scale range (`stat_bin()`).
#> Warning: Computation failed in `stat_bin()`.
#> Caused by error in `bin_breaks_width()`:
#> ! The number of histogram bins must be less than 1,000,000.
#> ℹ Did you make `binwidth` too small?
#> Warning: Removed 218 rows containing non-finite outside the scale range
#> (`stat_density()`).
#> Warning: Removed 278 rows containing non-finite outside the scale range (`stat_bin()`).
#> Warning: Computation failed in `stat_bin()`.
#> Caused by error in `bin_breaks_width()`:
#> ! The number of histogram bins must be less than 1,000,000.
#> ℹ Did you make `binwidth` too small?
#> Warning: Removed 278 rows containing non-finite outside the scale range
#> (`stat_density()`).
 #> Warning: Removed 278 rows containing non-finite outside the scale range (`stat_bin()`).
#> Warning: Computation failed in `stat_bin()`.
#> Caused by error in `bin_breaks_width()`:
#> ! The number of histogram bins must be less than 1,000,000.
#> ℹ Did you make `binwidth` too small?
#> Warning: Removed 278 rows containing non-finite outside the scale range
#> (`stat_density()`).
#> Warning: Removed 255 rows containing non-finite outside the scale range (`stat_bin()`).
#> Warning: Computation failed in `stat_bin()`.
#> Caused by error in `bin_breaks_width()`:
#> ! The number of histogram bins must be less than 1,000,000.
#> ℹ Did you make `binwidth` too small?
#> Warning: Removed 255 rows containing non-finite outside the scale range
#> (`stat_density()`).
 #> Warning: Removed 255 rows containing non-finite outside the scale range (`stat_bin()`).
#> Warning: Computation failed in `stat_bin()`.
#> Caused by error in `bin_breaks_width()`:
#> ! The number of histogram bins must be less than 1,000,000.
#> ℹ Did you make `binwidth` too small?
#> Warning: Removed 255 rows containing non-finite outside the scale range
#> (`stat_density()`).
#> Warning: Removed 285 rows containing non-finite outside the scale range (`stat_bin()`).
#> Warning: Computation failed in `stat_bin()`.
#> Caused by error in `bin_breaks_width()`:
#> ! The number of histogram bins must be less than 1,000,000.
#> ℹ Did you make `binwidth` too small?
#> Warning: Removed 285 rows containing non-finite outside the scale range
#> (`stat_density()`).
 #> Warning: Removed 285 rows containing non-finite outside the scale range (`stat_bin()`).
#> Warning: Computation failed in `stat_bin()`.
#> Caused by error in `bin_breaks_width()`:
#> ! The number of histogram bins must be less than 1,000,000.
#> ℹ Did you make `binwidth` too small?
#> Warning: Removed 285 rows containing non-finite outside the scale range
#> (`stat_density()`).
#> `stat_bin()` using `bins = 30`. Pick better value `binwidth`.
 #> `stat_bin()` using `bins = 30`. Pick better value `binwidth`.
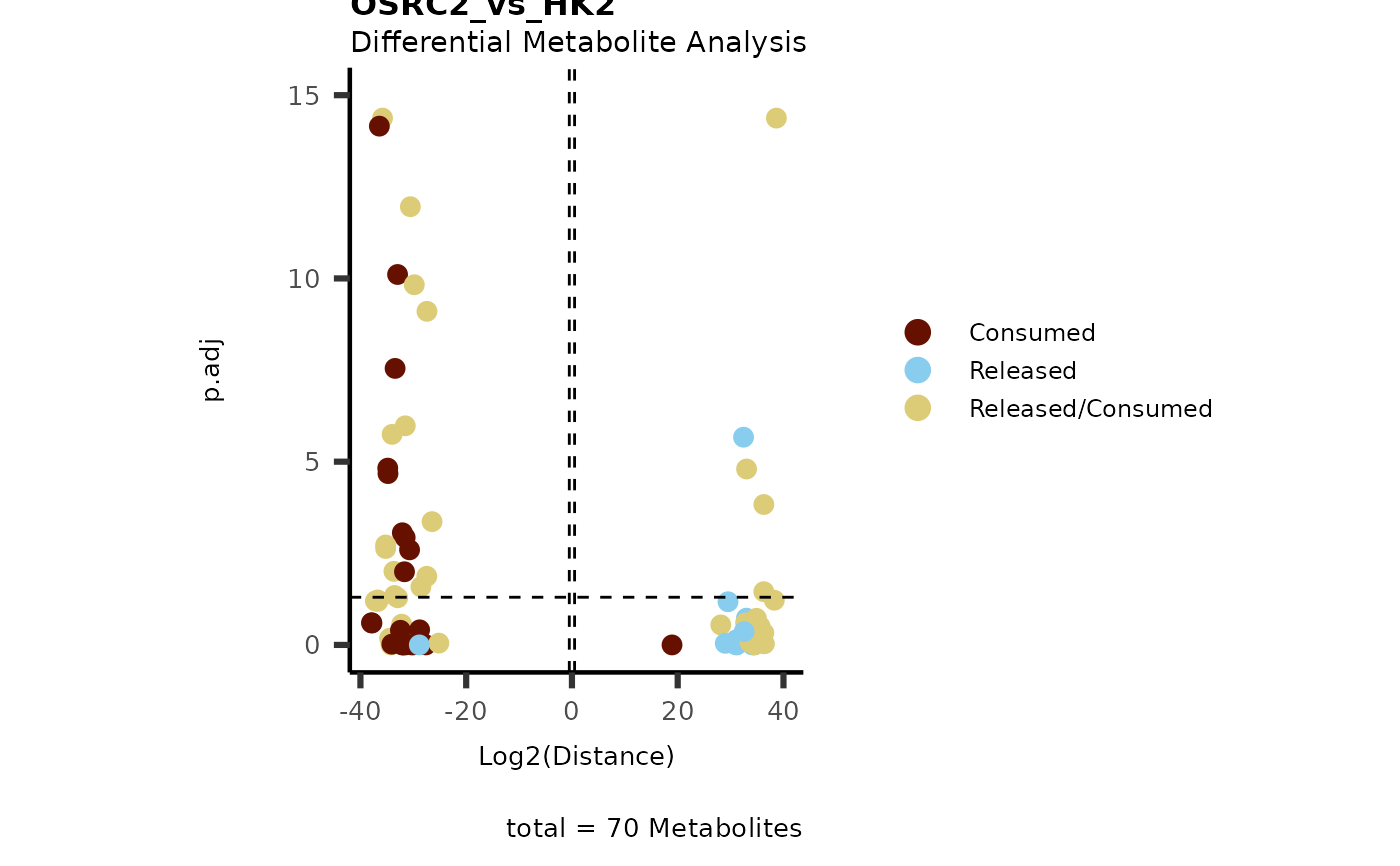
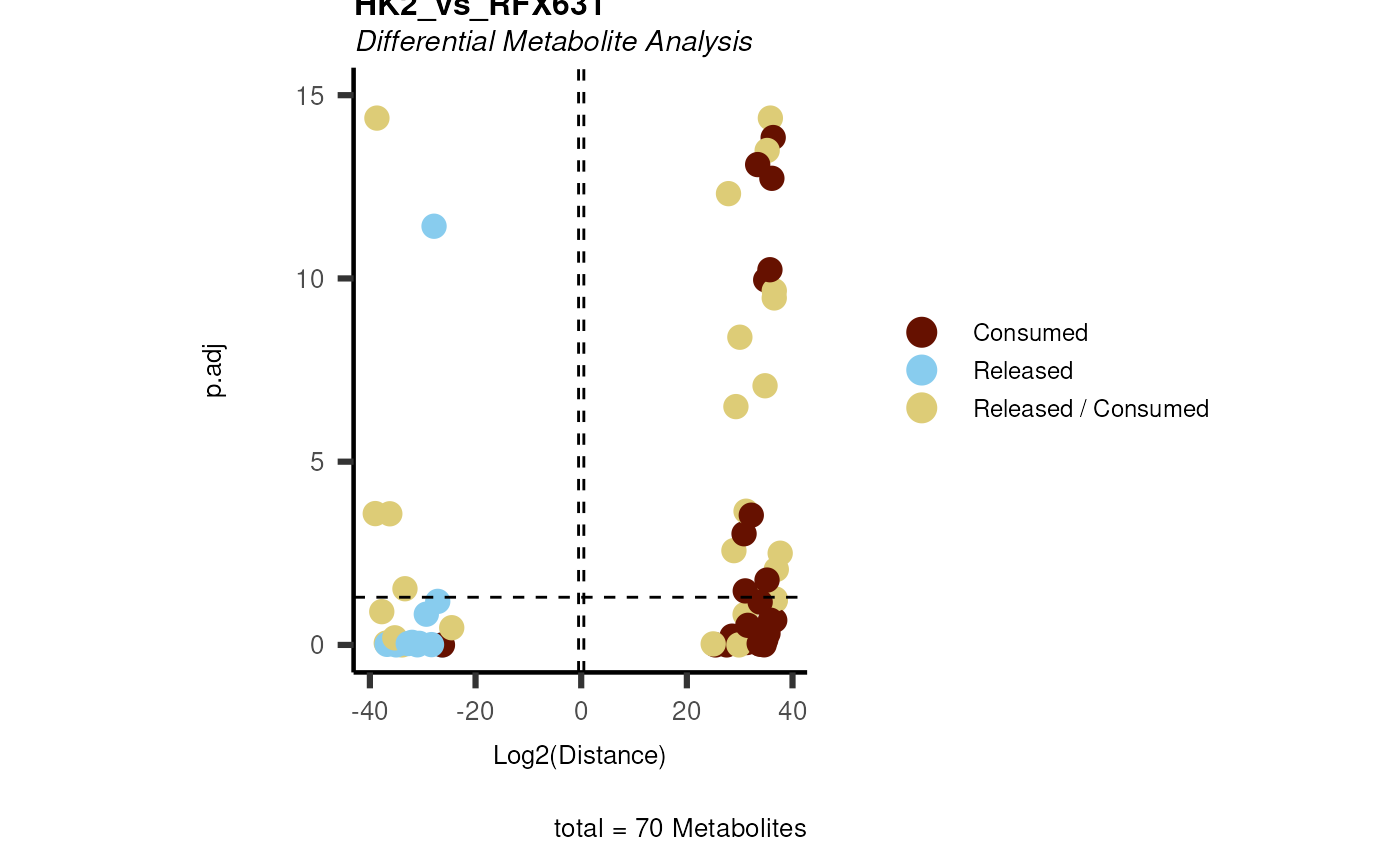 data(intracell_dma)
IntraDMA <- intracell_dma
Res <- mca_core(
data_intra = as.data.frame(IntraDMA),
data_core = as.data.frame(MediaDMA[["dma"]][[1]])
)