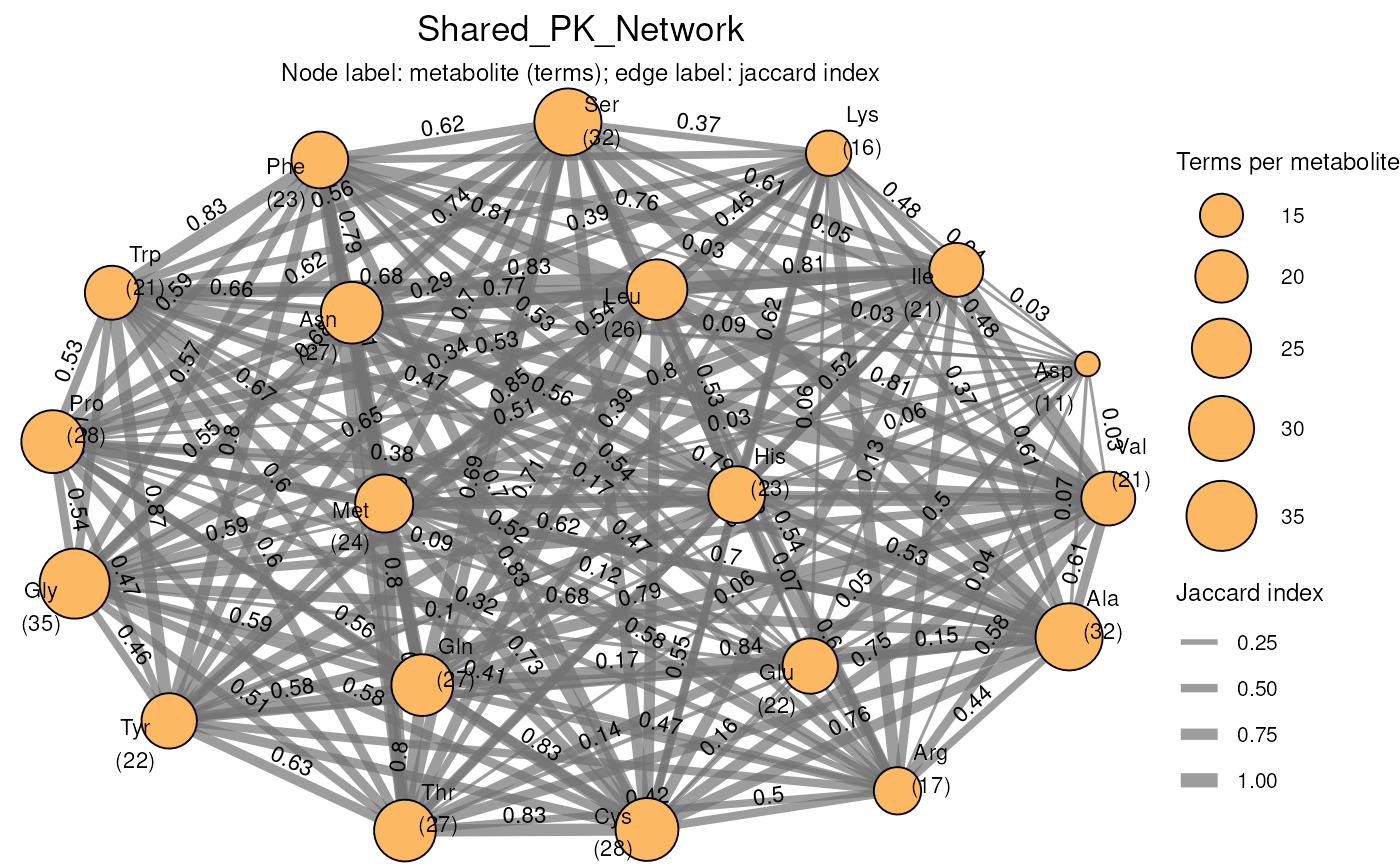
Network of metabolites connected by shared prior knowledge terms
Source:R/VizPKNetwork.R
viz_shared_pk_network.RdConnect measured metabolites that are linked to the same prior knowledge
(PK) terms, e.g. metabolites binding the same receptors in
metsigdb_metalinks(), taking part in the same pathways in
metsigdb_kegg() or reported in the same cancer types in
metsigdb_macdb(). Node size and the number beneath each label show how
many terms a metabolite is linked to; edge width and labels show the
similarity of two metabolites.
Usage
viz_shared_pk_network(
  feature_metadata,
  input_pk,
  metadata_info,
  similarity = c("shared", "jaccard"),
  threshold = 0,
  show_unconnected = FALSE,
  edge_labels = TRUE,
  id_type = "HMDB",
  id_sep = ";",
  label_mode = c("all", "reduced"),
  label_max_chars = 20,
  label_degree_min = 1,
  label_repel = TRUE,
  seed = NULL,
  layout = "stress",
  plot_name = "Shared_PK_Network",
  save_plot = "svg",
  save_table = NULL,
  print_plot = TRUE,
  path = NULL,
  plot_width = 25,
  plot_height = 20,
  plot_unit = "cm"
)
Arguments
- feature_metadata
Data frame with one row per measured feature, holding the ID column and optional label and attribute columns.
- input_pk
Prior knowledge in long format, i.e. one metabolite ID per row, such as the tables returned by the
metsigdb_*()functions.- metadata_info
Named character vector mapping roles to column names:
- InputID
Required. ID column in
feature_metadata.- PriorID
Required. ID column in
input_pk.- PriorTerm
Required. Column in
input_pkwhose values become the term nodes, e.g. "gene_symbol" or "term".- InputLabel
Metabolite label column in
feature_metadata. Without it, or for missing labels, the IDs are used.- MetaboliteColor, MetaboliteSize
Columns in
feature_metadatafor the fill and size of metabolite nodes. Size must be numeric.- TermColor, TermSize
Columns in
term_metadata, or else ininput_pk, for the fill and size of term nodes. Size must be numeric.- EdgeColor, EdgeLinetype, EdgeWidth
Columns in
input_pkfor the colour, line type and width of edges. Width must be numeric; by default it is the number ofinput_pkrows behind an edge.- EdgeDirection
Column in
input_pkholding the edge direction (see Details).
- similarity
Optional: Edge weight:
"shared"(number of shared terms) or"jaccard"(shared terms divided by the terms of either metabolite). Default = "shared"- threshold
Optional: Minimum
similarityfor two metabolites to be connected, as incluster_pk(). Metabolites without shared terms are never connected. Forsimilarity = "shared"this is the minimum number of shared terms. Default = 0- show_unconnected
Optional: If TRUE, metabolites without any connection are plotted as well. Default = FALSE
- edge_labels
Optional: If TRUE, edges are labelled with their weight. Set to FALSE for dense networks, where the edge width still shows the weight. Default = TRUE
- id_type
Optional:
"HMDB"to normalise HMDB IDs before matching. Any other value (e.g. "KEGG", "PubChem") matches IDs exactly. Default = "HMDB"- id_sep
Optional: Separator of multiple IDs in one cell of the
InputIDcolumn. Default = ";"- label_mode
Optional:
"all"labels all metabolites;"reduced"labels only metabolites connected to at leastlabel_degree_minother metabolites. Default = "all"- label_max_chars
Optional: Labels longer than this are shortened with "...". Default = 20
- label_degree_min
Optional: Minimum number of connected metabolites if
label_mode = "reduced". Default = 1- label_repel
Optional: If TRUE, labels are repelled from each other. Default = TRUE
- seed
Optional: Seed for random layouts such as "fr". With
NULLthe layout changes between calls. The global random seed is not changed. Default = NULL- layout
Optional: Graph layout passed to
ggraph::ggraph(), e.g. "stress", "fr" (force-directed) or "kk". Default = "stress"- plot_name
Optional: Plot title and name of the saved files. Default = "Shared_PK_Network"
- save_plot
Optional: File type of the saved plot: "svg", "pdf", "png" or NULL. Default = "svg"
- save_table
Optional: File type of the saved tables: "csv", "xlsx", "txt" or NULL. Default = NULL
- print_plot
Optional: If TRUE, the plot is printed. Default = TRUE
- path
Optional: Path to the folder the results are saved in. Default = NULL
- plot_width, plot_height, plot_unit
Optional: Size of the saved plot. Default = 25 x 20 cm
Value
A list with
- DF
List of
edges(one row per connected metabolite pair withshared,jaccard, the plottedweightand theshared_terms),nodes(one row per metabolite withn_termsand the mapped attributes),associations(the metabolite-term pairs the network is based on),matched_featuresandunmatched_features.- Plot
List with the ggraph plot
shared_pk_network, orNULLif no feature matchedinput_pk.
Details
Metabolites are matched to input_pk as in viz_pk_network(), so the
same metadata_info can be passed to both functions. Only InputID,
InputLabel, PriorID, PriorTerm, MetaboliteColor and
MetaboliteSize are used here; other entries are ignored.
The raw number of shared terms favours metabolites with many terms. Use
similarity = "jaccard" to compare the term profiles of two metabolites
as a whole. The Jaccard index is calculated as in cluster_pk().
Metabolites that share no terms with any other plotted metabolite are left
out of the plot unless show_unconnected = TRUE; they are still listed in
the returned nodes table with a degree of 0.
To connect terms by the metabolites they share instead, use
cluster_pk(): with input_format = "enrichment" it takes an enrichment
result and only uses the measured metabolites behind each term.
See also
viz_pk_network() to show the terms themselves.
Examples
# Biocrates amino acids connected by the transporters they share
data(biocrates_features)
amino_acids <- biocrates_features %>%
    dplyr::filter(Class == "Aminoacids") %>%
    dplyr::select(TrivialName, HMDB)
aa_hmdb <- trimws(unlist(strsplit(amino_acids$HMDB, ",")))

transporters <- metsigdb_metalinks(
    hmdb_ids = aa_hmdb,
    save_table = NULL,
    exclude_metabolites = NULL
) %>%
    dplyr::filter(interaction_family == "Transporter-metabolite")

shared <- viz_shared_pk_network(
    feature_metadata = amino_acids,
    input_pk = transporters,
    metadata_info = c(
        InputID = "HMDB",
        InputLabel = "TrivialName",
        PriorID = "hmdb",
        PriorTerm = "gene_symbol"
    ),
    similarity = "jaccard",
    id_sep = ",",
    seed = 1,
    save_plot = NULL
)